Executive search firms that measure only activity will scale only activity. The firms that scale revenue, retention, and brand equity measure outcomes. The data is unforgiving. Roughly half of business leaders report no internal measures of executive search effectiveness, the retained industry average placement success rate sits at approximately 71 percent, and 40 percent of all executive searches fail outright. Inside this measurement vacuum, the firms that install structured KPI architecture pull away from the median. They place 85 to 95 percent of mandates, generate 80 percent plus repeat business by Stage 3, and command premium fee positioning that activity-tracking competitors cannot match.
This article maps the KPI infrastructure that distinguishes elite executive search practices from average ones. Audience: Managing Partners architecting practice measurement, operating partners and fund GPs evaluating search firm performance, CHROs running internal executive talent functions, and Practice Directors building dashboards. Coverage: the 5 outcome KPIs that predict practice value, the 5 activity KPIs that fuel them, the 5 financial KPIs that govern unit economics, the 3 quality KPIs that protect brand, the 3 brand KPIs that compound inbound demand, the AI-era new KPIs for 2026, the dashboard architecture by stakeholder, the reporting cadence by tier, the 8 common measurement mistakes, and the 7-step implementation roadmap.
Why Executive Search Needs Distinct KPIs
Generic recruiting metrics fail for retained executive search because they were designed for high-volume, low-value transactional hiring. SHRM time-to-fill benchmarks built around 6-week medians for individual contributor roles produce misleading signal when applied to a 90 to 120 day retained CEO mandate. The strategic measurement gap is structural. Most firms measure activity (outreach volume, candidate touches, interviews scheduled) rather than outcomes (placement success, 12-month retention, repeat business). Per HelloSky's executive search KPI benchmarking framework, the firms that consistently outperform install outcome-based measurement across four interconnected categories.

C-suite mandates and middle-management mandates require different KPI weightings. A CFO search measured against a 30-day time-to-fill standard rewards speed over rigour and creates the mis-hire pattern that AESC's State of the Industry research identifies as the single largest source of executive value destruction. The same time-to-fill metric applied to a Director-level commercial role produces appropriate optimisation pressure. The KPI architecture must therefore segment by mandate type, role seniority, and engagement model (retained, contingency, container) rather than collapse to firm-wide averages.
The 2026 measurement landscape is reshaped by three converging forces. First, escalating expectations from boards and PE investors who increasingly demand outcome reporting tied to enterprise value. Second, rapidly maturing AI-enabled recruiting workflows that introduce new productivity and quality measurement dimensions. Third, a growing insistence on longitudinal performance tracking at 6, 12, and 24 months post-placement rather than the historical industry default of stopping measurement at offer acceptance.
The 5 Core Outcome KPIs
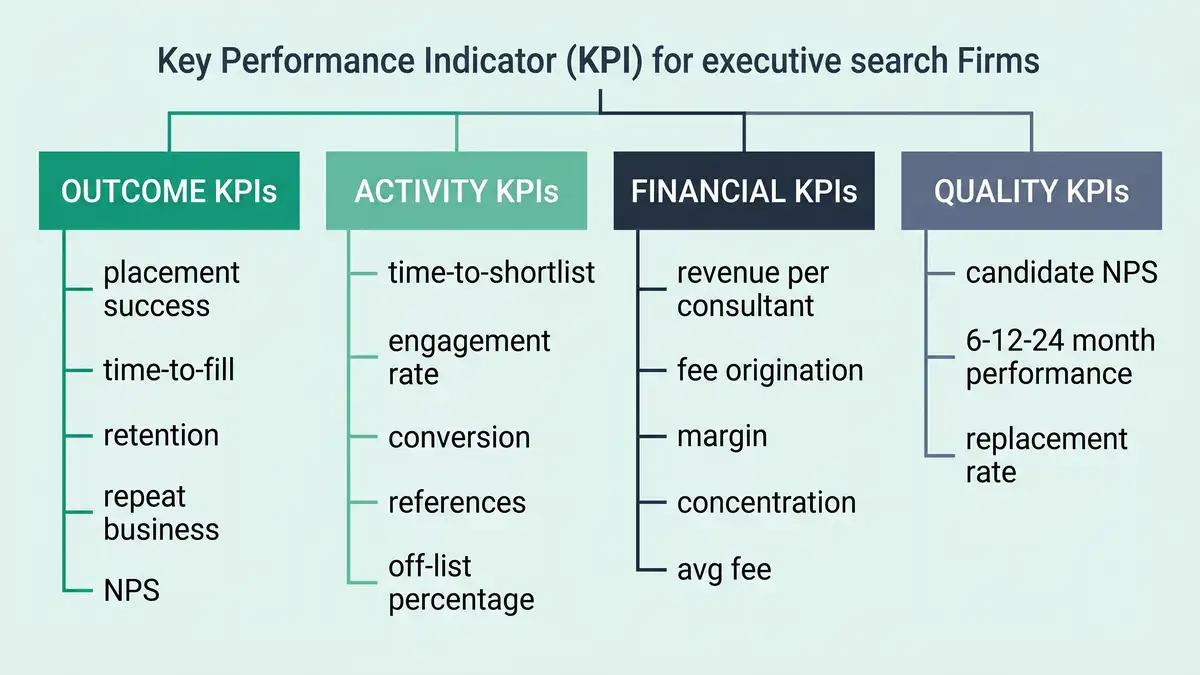
Outcome KPIs are the most predictive metrics for executive search practice value. They measure what the client actually buys: a leader who lands, performs, and stays. Activity KPIs fuel outcomes but cannot replace them as the primary measurement frame.
| Outcome KPI | Industry Benchmark | Boutique Target |
| Placement success rate | 71% retained average / 40% overall failure | 85%+ multi-year average |
| Time-to-fill / time-to-start | 123 days retained average | 90-120 days C-suite, paired with quality |
| 12 / 24 month retention | 12-month replacement guarantee standard | 90%+ retention at 12 months |
| Client repeat business rate | 79% of firms get 50%+ from repeats | 80%+ over 3-year window at Stage 3 |
| NPS at search conclusion | B2B benchmark 50+ / world-class 70+ | 50+ client, 30-50 candidate |
Sources: Clockwork Recruiting Success Metrics, Cowen Partners Search Failure Rate Analysis, Great Recruiters Industry Statistics
Placement success rate is the leading outcome metric. Retained boutiques operating at AESC-tier methodology place 85 to 95 percent of mandates versus 20 to 35 percent at contingency firms, per Rich Group's retained versus contingency analysis. The 250 to 475 percent success-rate differential reflects the structural commitment of retained engagement and the methodology depth that follows. Track placement success quarterly and annually, segmented by practice, sector, and seniority. Firm-wide averages hide the practice-level variance that determines where investment and remediation should land.
Time-to-fill requires segmentation. C-suite roles take 90 to 120 days, VP-level 60 to 90 days, technical leadership (CTO, CISO) 100 to 130 days, public sector 90 to 150 days. The retained industry average sits at 123 days. Time-to-fill optimised in isolation degrades quality, a pattern documented in our analysis of the executive search process. The defence is pairing time-to-fill with 12-month placement performance to detect speed-versus-rigour trade-offs early.
12 and 24 month retention closes the measurement loop that most firms leave open. The 12-month replacement guarantee is industry standard for retained engagements, per JRG Partners' replacement guarantee documentation. Best-practice firms extend tracking to 24 months and to performance dimensions (meets or exceeds objectives, time to impact) rather than binary retention. Client repeat business rate measures the trust dividend. Per Great Recruiters' 2023 industry statistics, 79 percent of agencies generate 50 percent plus from repeat clients. Stage 3 boutiques should target 80 percent plus over a 3-year window. NPS at search conclusion, collected from both clients and candidates, captures the relationship quality that drives long-term economics.
The 5 Core Activity KPIs

Activity KPIs are leading indicators that signal whether outcome KPIs will hit target. They are operationally useful, not strategically sufficient. Track them weekly at consultant level, monthly at practice level.
Time to shortlist measures the gap between engagement letter and first qualified slate. Industry baseline runs 21 to 45 days for C-suite mandates, with the lower bound representing well-instrumented practices and the upper bound representing market-mapping complexity at the very top end. Candidate engagement rate tracks the percentage of outreach that produces meaningful response (not just opened LinkedIn messages). Senior VP commercial roles see 25 to 30 percent engagement; niche CTO mandates in hot markets see 10 to 15 percent. Interview-to-offer conversion ratio measures shortlist quality. NACE benchmarks suggest 47.5 percent interview-to-offer and 69.3 percent offer-to-acceptance directionally for executive-level transferable application.
Reference-check completion rate should track at 100 percent for retained finalists. Anything lower signals time-pressure shortcuts that produce the integrity failures retained methodology exists to prevent. Off-list reference percentage measures methodology depth. Best-practice retained firms produce 40 to 60 percent off-list references (sources the candidate did not provide). On-list-only reference work surfaces integrity issues at month nine instead of month two.
The 5 Core Financial KPIs

Financial KPIs govern the unit economics that determine practice viability and growth capacity. They are most useful when segmented by stage of practice maturity, per the 5-stage practice maturity framework.
Revenue per consultant by stage: Stage 1 solo consultant 150K to 500K USD at 60-70 percent margin; Stage 2 founder plus researchers 500K to 1.5M USD at 35-55 percent margin; Stage 3 small team boutique 1.5M to 5M USD total at 25-35 percent margin; Stage 4 mid boutique 5M to 20M USD at 20-30 percent margin; Stage 5 scale boutique 20M to 100M USD at 18-28 percent margin. Fee origination per consultant at Stage 3: founder MP 800K-1.5M USD, senior consultants 600K-1M USD, mid-level 400K-700K USD, with senior consultant total compensation typically at 25 to 35 percent of personal billings.
Net margin per mandate tracks unit profitability. The main erosion drivers are scope creep, client indecision producing extended cycle times, and position-profile resets mid-search. Revenue concentration measures client risk. Per Korn Ferry's leadership insights research and broader practice benchmarks, single-customer revenue should stay under 10 percent and top-5 client revenue should stay under 25 to 30 percent (under 20 percent for M&A and IPO-bound firms). Average fee per mandate at retained search is 25 to 35 percent of first-year compensation, producing 130K to 175K USD on a 400K USD executive role and 150K to 300K USD on typical mid-market CEO and CRO mandates, per our pricing models analysis.
The 3 Quality KPIs

Quality KPIs catch the longitudinal performance issues that outcome and activity KPIs miss. They are the leading indicator of brand reputation and the predictor of repeat business.
Candidate NPS should target 30 to 40 minimum at early stages, scaling to 50 plus at Stage 3 and above. AESC's Candidate Bill of Rights provides the ethical baseline that anchors candidate experience measurement. Collect NPS at shortlist presentation, search closure, and 6-12 months post-placement. Placement performance at 6, 12, and 24 months is the AESC top-1 client metric. GSI Executive Search's process documentation details a 30/60/90/180-day post-placement review structure that captures impact velocity. Replacement rate within guarantee window should run under 5 to 7 percent for healthy practices. 10 to 12 percent plus signals systemic assessment or onboarding failure.
The 3 Brand KPIs
Brand KPIs measure the compounding investments that determine long-term inbound demand. They lag outcome and activity metrics by 12 to 18 months but produce the disproportionate returns that distinguish premium practices.
Inbound mandate rate tracks the percentage of new client engagements that originated from inbound channels (thought leadership, referrals, brand recognition) versus outbound business development. Target 40 percent plus inbound for established firms. LinkedIn engagement measures Managing Partner share of voice via profile views, post engagement rate, and follower growth. Per Edelman's B2B Thought Leadership Impact research, executive decision-makers cite Managing Partner LinkedIn content as a primary discovery channel. Press citations and analyst mentions tracked quarterly and tied to inbound mandate rate quantify earned media value.
Architecting the recruiting operating system that compounds KPI measurement across your practice?
Book a Growth Mapping CallAI-Era New KPIs for 2026
AI-enabled sourcing has introduced a new measurement category that did not exist in the executive search KPI canon three years ago. Per Bullhorn's GRID 2026 Recruitment Industry Trends Report, top-performing firms now report 30 to 40 percent cost-per-hire reduction, up to 85 percent time-to-fill compression on transactional searches, 45 percent administrative time savings, and 11 to 25 percent KPI improvements through structured AI adoption. The new metrics layer on top of the traditional KPI framework rather than replace it.
AI sourcing efficiency tracks the ratio of AI-augmented sourcing output to baseline manual sourcing. Measured as longlist candidates produced per consultant hour, percentage reduction in initial qualification time, and cost-per-qualified-candidate compression. AI scoring accuracy tracks the predictive value of AI candidate scoring against placement outcomes: percentage of AI-shortlisted candidates advancing to interview, to offer acceptance, and correlation with 12-month performance ratings. AI-assisted outreach response rate compares response rates from AI-augmented personalised outreach against control outreach using A/B testing.
The structural insight is that AI infrastructure is now table stakes at the mid-management and VP tier, but human consultant judgement remains the differentiator at the C-suite tier where industry-wide disruption pressure and structured assessment frameworks require capabilities AI does not replicate. Per RecruiterFlow's analysis of AI for executive search, the firms generating the strongest 2026 economics are those measuring both AI productivity gains and human-judgement quality preservation.
KPI Targets by Practice Maturity Stage
| Stage | Revenue Range | Net Margin | Placement Rate | Repeat Business |
| 1 Solo Consultant | 150K-500K USD | 60-70% | 70%+ | 50%+ |
| 2 Founder + Researchers | 500K-1.5M USD | 35-55% | 75%+ | 60%+ |
| 3 Small Team Boutique | 1.5M-5M USD | 25-35% | 80-85%+ | 70-80%+ |
| 4 Mid Boutique | 5M-20M USD | 20-30% | 85%+ | 75-80%+ |
| 5 Scale Boutique | 20M-100M USD | 18-28% | 85-90%+ | 80%+ |
Sources: Hunt Scanlon Executive Search 2026 Trends, HelloSky KPI Benchmarking
The KPI Dashboard Architecture
The 4-tier dashboard architecture separates daily operational visibility from strategic firm-level measurement. Each tier serves a distinct stakeholder with a distinct cadence.
Operations Dashboard (Consultant, Daily and Weekly)
Tracks outreach volume, candidate engagement rate, shortlist progression, interview-to-offer conversion, reference completion status. Owner: individual consultant. Used to manage personal pipeline velocity and identify mandate-level risk early.
Mandate Dashboard (Per Search, Weekly)
Tracks days elapsed against milestone targets, slate health (shortlist size and quality scores), references completed, client interview cycle status, offer pipeline. Owner: lead consultant and Practice Director. Used for weekly mandate review and resource rebalancing.
Practice Dashboard (Managing Partner, Monthly)
Tracks practice-level placement rate, time-to-fill across mandates, client and candidate NPS averages, net margin per consultant, revenue concentration, fee origination by consultant. Owner: Managing Partner. Used for monthly practice review and consultant performance management.
Firm Scorecard (Board and Investors, Quarterly)
Tracks firm-wide revenue per consultant, total fee origination, top-5 client concentration, 12 and 24 month retention cohorts, brand metrics (inbound mandate rate, LinkedIn engagement, press citations). Owner: Managing Partner, presented to board, PE sponsors, or investors. Used for strategic positioning, valuation discussions, and exit preparation.
Reporting cadence runs week-over-week for real-time pulse on operations and mandate health, month-over-month for trend validation at practice level, and quarter-over-quarter for strategic decisions at firm scorecard level. The 3-tier cadence prevents the most common dashboard failure: reviewing strategic metrics too frequently and operational metrics too infrequently.
The 8 Common KPI Measurement Mistakes
Mistake 1: Activity-only dashboards
Tracking outreach volume without anchoring to placement success. Activity is necessary but not sufficient; firms scaling only activity scale only burn rate.
Mistake 2: Generic recruiting benchmarks
Applying SHRM 6-week median time-to-fill to a retained C-suite mandate. The benchmark is built for individual contributor hiring; using it on executive search produces speed-over-quality optimisation.
Mistake 3: No longitudinal tracking
Stopping measurement at offer acceptance. Skipping 12 and 24 month performance and retention tracking leaves the most important quality signal uncaptured.
Mistake 4: Aggregated reporting hiding variance
Firm-wide averages obscure practice, function, and seniority variance that determines where investment and intervention should land.
Mistake 5: Ignoring candidate NPS
Measuring only client satisfaction. Candidate experience is the leading indicator of long-term talent network depth and referral velocity.
Mistake 6: Reference shortcuts under time pressure
Allowing reference completion to drop below 100 percent on retained finalists, especially on off-list references. The shortcut produces month-9 integrity failures that retained methodology exists to prevent.
Mistake 7: No AI baseline
Adopting AI sourcing without measuring scoring accuracy, sourcing efficiency, or pre-versus-post deltas. Without baseline measurement, AI adoption produces unmeasured productivity claims that erode at the C-suite tier.
Mistake 8: Revenue concentration blindness
Failing to track top-5 client revenue concentration. Concentration above 25 to 30 percent represents an existential risk that quarterly financial KPI reporting should surface continuously.
The 7-Step KPI Implementation Roadmap
Define mandate-level KPI baseline per practice and seniority
Document target placement rate, time-to-fill, repeat business rate, and NPS by practice (sector or function) and by mandate seniority tier (C-suite, VP, Director). Without segmented baselines, firm-wide averages produce false signal.
Instrument ATS / CRM
Configure Bullhorn, Recruiterflow, Invenias, Clinch, ThriveTRM, or Crustdata with mandatory field structures, stage-gate workflows, and KPI-aligned reporting. Per HRShelf's ATS implementation analysis, 78 percent of ATS rollouts fail when the structured implementation roadmap is ignored, a risk also covered in our overview of executive search firm operations.
Add post-hire performance loop
Implement 30/60/90/180-day post-placement check-ins plus 12 and 24 month performance reviews. Capture meets-or-exceeds-objectives ratings, time-to-impact assessments, and retention status. This is the most commonly skipped step and the highest-leverage one.
Roll out client and candidate NPS automation
Automated NPS survey at shortlist presentation, search closure, and 6-12 month milestones. Segment results by consultant, practice, and mandate type. NPS dashboards should be visible at consultant level to drive accountability.
Layer financial KPIs and tie to compensation
Per-consultant revenue and origination, net margin per mandate, revenue concentration, and average fee per mandate, integrated with commission and bonus structures. The compensation linkage is what makes KPI tracking change behaviour rather than remain reporting overhead.
Add AI productivity KPIs
AI scoring accuracy versus placement outcomes, sourcing efficiency (longlist per consultant hour), AI-assisted outreach response rate via A/B testing. The new KPI layer should ride alongside traditional metrics, not replace them.
Establish reporting cadence
Weekly operations and mandate review at consultant and Practice Director level, monthly practice review at Managing Partner level, quarterly firm scorecard at board and investor level. Lock the cadence with calendar invitations and standardised report templates.
The KPI maturity insight
Firms that install KPI infrastructure as a system (not as a one-time dashboard build) generate compounding returns. Year one is data hygiene and baseline establishment. Year two is variance reduction and outcome improvement. Year three is brand differentiation and premium fee capture. The KPI implementation roadmap is itself a 3-year capability build that distinguishes elite practices from the median.
Architect the recruiting operating system that turns KPI measurement into compounding practice value
Elite executive search firms scaling through the 2026 industry transformation need integrated KPI infrastructure across operations, mandate, practice, and firm scorecard tiers. peppereffect installs the agentic workflows that decouple measurement from manual reporting overhead, automate the 70 percent of data hygiene work, and protect the AESC-tier methodology depth that justifies premium retained engagement positioning. The Freedom Machine framework directly addresses the measurement bottleneck that prevents most practices from compounding outcome KPIs into brand equity.
Book a Growth Mapping CallFrequently Asked Questions
What are the most important executive search KPIs?
The five most important executive search KPIs are placement success rate (target 85 percent plus for retained boutiques against 71 percent industry average and 40 percent broader failure rate), time-to-fill or time-to-start (60-90 days for retained C-suite mandates), 12 and 24 month retention and placement performance, client repeat business rate (80 percent plus by Stage 3 maturity), and Net Promoter Score collected from both clients and candidates at search conclusion and 6-12 months post-placement. These outcome KPIs predict practice value far better than activity metrics alone.
What is a good time-to-fill for executive search?
Industry benchmarks for retained executive search time-to-fill in 2026 are 90 to 120 days for C-suite roles, 60 to 90 days for VP-level mandates, 100 to 130 days for technical leadership roles like CTO and CISO, and 90 to 150 days for public sector and nonprofit searches. The retained average across all mandates is approximately 123 days. Time-to-shortlist (first qualified slate to client) should run 21 to 45 days. Optimising time-to-fill in isolation degrades quality. Pair the metric with placement performance at 12 months.
What is a good placement success rate for retained search?
Retained executive search placement success rates run 85 to 95 percent at well-run boutiques versus 20 to 35 percent at contingency firms, with the industry-wide average around 71 percent for retained engagements and an overall 40 percent failure rate across all search models. Stage 3 small team boutiques should target 80 to 85 percent placement success, Stage 4 mid boutiques 85 percent plus, and Stage 5 scale boutiques 85 to 90 percent. The 250 to 475 percent success rate differential between retained and contingency reflects the structural commitment of retained engagement.
What revenue per consultant should an executive search firm target?
Revenue per consultant targets by practice maturity stage are: Stage 1 solo consultant 150,000 to 500,000 USD at 60-70 percent net margin; Stage 2 founder plus researchers 500,000 to 1,500,000 USD at 35-55 percent margin; Stage 3 small team boutique 1,500,000 to 5,000,000 USD total with per-consultant fee origination of 400K-1.5M USD at 25-35 percent margin; Stage 4 mid boutique 5,000,000 to 20,000,000 USD at 20-30 percent margin; Stage 5 scale boutique 20,000,000 to 100,000,000 USD at 18-28 percent margin. Senior consultant total comp typically lands at 25-35 percent of personally produced billings.
What is candidate NPS in executive search?
Candidate Net Promoter Score (NPS) measures the willingness of executive candidates to recommend the search firm to peers, calculated on a 0-10 scale as percentage Promoters (9-10) minus percentage Detractors (0-6). B2B benchmark is 50 plus, world-class is 70 plus. Executive search firms should target candidate NPS of 30 to 40 minimum at Stage 1 and 2, scaling to 50 plus at Stage 3 and above. Candidate NPS should be collected at shortlist presentation, search closure, and 6-12 months post-placement. AESC's Candidate Bill of Rights provides the ethical baseline that anchors candidate experience measurement.
What KPI dashboard should an executive search firm build?
Executive search firms should build a 4-tier dashboard architecture: Operations dashboard (consultant, daily and weekly tracking outreach, shortlists, conversion ratios); Mandate dashboard (per search, weekly tracking days elapsed, slate health, references completed); Practice dashboard (Managing Partner, monthly tracking placement rate, time-to-fill, NPS, net margin); Firm scorecard (board and investors, quarterly tracking revenue per consultant, fee origination, concentration, retention cohorts, brand metrics). Reporting cadence runs week-over-week for real-time pulse, month-over-month for trend validation, quarter-over-quarter for strategic decisions.
How is AI changing executive search KPIs?
AI is introducing three new KPI categories to executive search: AI sourcing efficiency (30-40 percent cost-per-hire reduction, up to 85 percent time-to-fill compression on transactional searches, 45 percent administrative time savings, 11-25 percent KPI improvements per Bullhorn GRID 2026); AI scoring accuracy (percentage of AI-shortlisted candidates advancing to interview and offer, correlation with 12-month placement performance); AI-assisted outreach response rate (A/B testing against control outreach). The structural shift is from reactive sourcing to proactive continuous-pipeline talent strategy enabled by AI infrastructure, with human consultant judgement remaining the differentiator at the C-suite tier.
Resources
- HelloSky: Executive Search KPI Benchmarking Framework
- Clockwork Recruiting: Executive Search Success Metrics
- Cowen Partners: Why Nearly Half of Executive Searches Fail
- Rich Group: Retained vs Contingency Search Models
- Great Recruiters: 2023 Recruitment Industry Statistics
- JRG Partners: Retained Search Replacement Guarantee
- AESC: State of the Industry Research
- AESC: Candidate Bill of Rights and Standards
- GSI Executive Search: Process Documentation
- Bullhorn GRID 2026: Recruitment Industry Trends Report
- RecruiterFlow: AI for Executive Search
- Hunt Scanlon: Executive Search 2026 Trends
- Edelman: B2B Thought Leadership Impact Study
- Korn Ferry: Leadership Insights Research
- HRShelf: ATS Implementation Guide
10-channel sourcing architecture Boolean search productivity benchmarks talent mapping deliverables and KPIs revenue per recruiter and margin optimization client relationship management discipline operations manual that anchors the KPI dashboard