

What Is SaaS Unit Economics and Why Does It Determine Company Survival?
SaaS unit economics is the per-customer financial reality that underlies every recurring-revenue business — whether the profit generated by one customer across their lifetime exceeds both the cost to acquire them and the cost to serve them. For mid-market SaaS companies operating in the $10-40M ARR band, unit economics has shifted from a board-level conversation topic to an existential survival metric. The median B2B SaaS company now spends $2.00 to acquire $1.00 of new ARR, a 14% deterioration from 2023 benchmarks that is compressing valuations, tightening fundraising terms, and exposing structural inefficiency across the industry. Rule of 40 score
This is not a reporting problem. It is an architecture problem. Most finance teams present "half-loaded" CAC numbers to their boards that make unit economics appear 2-3x healthier than they actually are. They exclude fully-loaded SDR compensation, marketing tooling, creative production, and RevOps overhead allocation — producing a LTV:CAC ratio on the board deck that collapses under scrutiny. Unit economics discipline is how you see the real picture and install the levers to fix it before deterioration cascades through two or three quarters of operations.
The parent discipline of unit economics applies beyond software, but SaaS variants carry three structural features that distinguish them: revenue arrives as a stream of small monthly or annual payments (creating cash-flow lag), churn compounds exponentially (a 2% monthly rate eliminates 22% of the customer base annually), and marginal cost-to-serve approaches zero on pure software (driving gross margins to 70-90% if infrastructure is efficient). These three factors combine into an economics profile that rewards retention and margin expansion over acquisition hyperscaling.
What you'll learn in this framework:
- The four canonical unit economics metrics and the fifth hidden dimension most CEOs miss
- The 2025-2026 benchmark landscape for LTV:CAC, CAC payback, gross margin, and NRR
- Precise formulas with fully-loaded cost calculations that expose the "CAC reporting gap"
- The five leading indicators of unit economics deterioration — weeks before headline metrics move
- The four compounding levers that can lift LTV:CAC by 46-62% over 12 months
- The board-level reporting framework that exposes hidden decay by cohort and segment
- How agentic automation is restructuring CAC economics and creating a structural advantage for early adopters
Key Takeaway
Unit economics deterioration typically precedes revenue decline by two to three quarters. CEOs who install cohort-level reporting, fully-loaded CAC calculation, and the four compounding levers can achieve 46%+ LTV:CAC improvement through disciplined execution — and decouple revenue growth from headcount inflation through B2B growth operating systems that replace manual sales and ops workflows with autonomous execution.

What Are the Four Canonical SaaS Unit Economics Metrics?
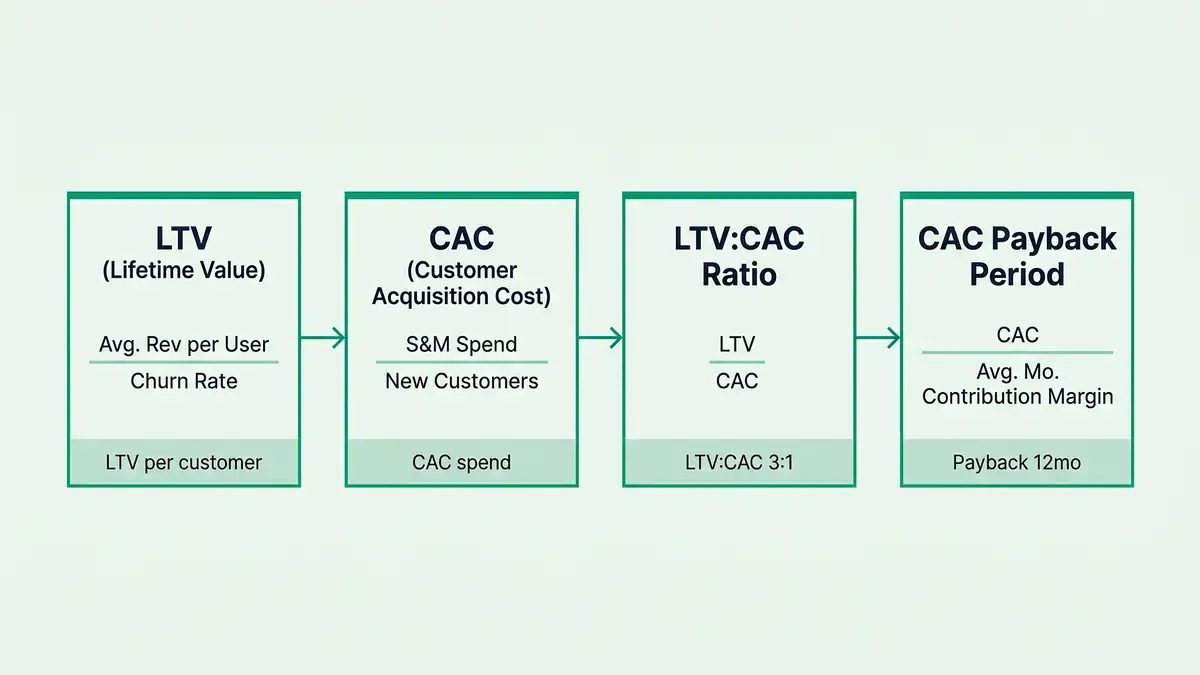
Four metrics form the backbone of SaaS unit economics analysis. Every CEO operating in the mid-market segment must understand both their calculation and their interdependencies. Blended reporting hides deterioration; formula precision exposes it.

Customer Lifetime Value (LTV) represents the total profit a company expects to generate from a customer relationship. The formula takes average revenue per account (ARPA), multiplies by gross margin to reflect actual profit contribution, and divides by monthly churn rate: LTV = (ARPA × Gross Margin %) ÷ Monthly Churn Rate. For a mid-market SaaS with $500 ARPA, 78% gross margin, and 2% monthly churn, LTV equals $19,500. The critical insight is that LTV is exponentially sensitive to churn. Doubling monthly churn from 3% to 6% cuts LTV by roughly half, while a 10% ARPA increase only moves LTV by 10%. Most CFOs under-prioritise churn reduction despite its geometric return profile.
Customer Acquisition Cost (CAC) measures the fully-loaded cost of converting a prospect into a paying customer. The formula is total sales and marketing expenses divided by new customers acquired. The execution risk lies entirely in the definition of "total sales and marketing spend" — the systemic gap that distorts every board deck in the industry.
LTV:CAC Ratio operationalises the relationship between lifetime value and acquisition cost. A ratio of 3:1 has long been the canonical minimum threshold for sustainable SaaS economics. However, 2025-2026 data from Bessemer Venture Partners reveals that elite mid-market performers now target 4:1 or 5:1, particularly as companies scale past $20M ARR. Ratios below 2:1 signal immediate problems; ratios above 6:1 may indicate underinvestment in growth. For mid-market SaaS, the zone of sustainable efficiency occupies 3:1 to 5:1.
CAC Payback Period measures how many months of gross profit contribution are needed to offset acquisition cost. Formula: CAC Payback = CAC ÷ Monthly Gross Margin per Customer. A company with $2,000 CAC and $400 monthly gross margin has a 5-month payback. According to Bantrr's 2025 benchmark data, the most efficient SaaS companies recover acquisition costs in under 12 months, the average payback period ranges between 20-30 months, and inefficient companies take 36-48 months. Bessemer's segmentation guidance: SMB-focused products target under 12 months, mid-market under 18 months, and enterprise under 24 months.
The fifth hidden dimension most CEOs miss is fully-loaded gross margin and contribution margin at the cohort level. Gross margin functions as a multiplier throughout all unit economics calculations. A company operating at 90% gross margin with $2,000 CAC achieves payback in 2.2 months; an otherwise identical company at 60% margin faces 3.3-month payback. Additionally, G-Squared CFO's analysis of SaaS unit economics shows that contribution margin tracked by cohort, segment, and channel often reveals that one channel runs at 1.5:1 LTV:CAC while another runs at 5:1. Blended reporting obscures this — allowing inefficient cohorts to hide within corporate averages.
What Are the 2025-2026 SaaS Unit Economics Benchmarks?
The benchmark environment has undergone a marked recalibration between 2024 and 2026, reflecting both the structural realities of market maturation and nascent productivity gains from agentic automation. Understanding where your company sits relative to these benchmarks requires a granular segment-by-segment assessment — thresholds for mid-market SaaS ($10-40M ARR) differ materially from both early-stage and enterprise segments.
| Metric | Bottom Quartile | Median | Top Quartile | Elite |
| LTV:CAC Ratio (mid-market) | <2:1 | 2.5:1 to 3.2:1 | 4:1 to 5:1 | 6:1+ |
| CAC Payback (mid-market) | >24 months | 15-20 months | <12 months | <9 months |
| Gross Margin (software-only) | <65% | 75-77% | 80-85% | 85%+ |
| Net Revenue Retention | <100% | 104-108% | 110-120% | 120%+ |
| New CAC Ratio ($ per $ new ARR) | >$2.50 | $2.00 | $1.20-$1.50 | <$1.20 |
| SaaS Magic Number | <0.5 | 0.6-0.7 | 0.75-1.0 | 1.0+ |
| Burn Multiple | >3.0x | 1.5-2.0x | 1.0-1.5x | <1.0x |
Sources: Benchmarkit 2025 SaaS Performance Metrics, Bessemer State of AI 2025, CloudZero Gross Margin Benchmarks, CRV NRR Benchmarks, Driven Insights Magic Number
The bifurcation is widening. G-Squared CFO's 2026 benchmarks show that a company at 3:1 LTV:CAC is technically viable but faces immediate cash flow and valuation pressure. A company at 4:1 can invest aggressively in growth while maintaining healthy margins. A company at 5:1 can achieve Rule of 40 profitability targets while scaling revenue at 25-30% YoY. For mid-market SaaS specifically, SaaS Capital's 2025 benchmarking (cited by CRV) shows bootstrapped $3-20M ARR companies at median NRR of 104%, with top quartile at 118% — meaning even in the best-performing tranche, NRR below 100% is common at smaller scales.
For companies embedding AI-native features, consumption-based pricing, or API-intensive architectures, gross margins compress to 55-65% due to variable infrastructure costs that scale with usage. This is a critical design consideration for any CEO integrating AI into the product roadmap. Agentic systems have their own measurement regime — conflating software gross margin with AI-inference gross margin will mis-price product tiers and misallocate growth capital.
Key Takeaway
Where you sit on this benchmark table determines your cost of capital, valuation multiple, and strategic options. Companies at median (LTV:CAC 3:1, payback 20 months, NRR 105%) can survive but cannot compound. Top-quartile performers (LTV:CAC 4:1+, payback <12 months, NRR 110%+) command 30-40% higher valuations and dramatically better fundraising terms. The gap is widening as agentic automation creates a structural advantage for early adopters.
Want to see your own CAC against peer benchmarks? Run the CAC Diagnostic for your true CAC, the 30 to 50% reduction agentic deployment delivers, and a board-ready PDF in 60 seconds.
Run the CAC DiagnosticWhy Is Your Reported CAC 2-3x Lower Than Reality?
CAC calculation suffers from systemic understatement across the industry. Most finance teams exclude fully-loaded SDR and Account Executive compensation, marketing tooling costs, creative production, overhead allocation, and data provider fees — producing CAC figures that are 50-150% too low. When fully-loaded CAC is correctly calculated, the median B2B SaaS company's New CAC Ratio reaches $2.00 per dollar of new ARR, up 14% from 2023 benchmarks.
Consider a typical mid-market SaaS acquiring 100 new customers in a quarter. Direct paid advertising: $40,000. Two SDRs at $80,000 quarterly loaded cost: $80,000. One Account Executive at $32,500 quarterly: $32,500. Salesforce, HubSpot, Outreach subscriptions: $15,000. LinkedIn Sales Navigator, ZoomInfo, Clearbit: $8,000. Creative production: $5,000. RevOps allocation: $10,000. Allocated facilities overhead: $12,000. Total fully-loaded acquisition spend: $202,500 ÷ 100 customers = $2,025 CAC per customer. The same team reporting only paid advertising ($40,000 ÷ 100) presents CAC as $400 — a 5x understatement.
This gap explains why most CFOs view their CAC as healthy, appearing to yield a LTV:CAC ratio of 48:1 at $19,500 LTV — when reality is 9.6:1, only marginally above the 3:1 sustainability threshold. According to First Page Sage's 2026 CAC benchmarks, most SaaS companies show a 2-3x gap between Paid CAC and Fully-Loaded CAC. The full SaaS CAC reduction playbook walks through each loaded-cost component and the payback implications.
Common Reporting Mistake
Dividing only ad spend by new customers and calling it CAC is the single most widespread board-level distortion in mid-market SaaS. If your calculation excludes fully-loaded sales comp (at 80% allocation for new business SDRs), tooling ($20,000+ per rep annually), and RevOps overhead — your board is seeing a LTV:CAC ratio that is 2-3x too optimistic. The fix: publish three CAC figures (Paid CAC, Blended CAC, Fully-Loaded CAC) and track each separately.
What Are the Five Leading Indicators of Unit Economics Deterioration?
CEOs typically discover that unit economics are broken through backward-looking metrics. By the time LTV:CAC ratio has visibly declined, the damage has cascaded through two to three quarters. The strategic discipline is to monitor five leading indicators that signal deterioration weeks or months before they manifest in headline numbers.
CAC Inflation Within Specific Channels
Rising cost-per-lead (CPL) in paid channels predicts rising CAC by 1-2 quarters. Weekly CPL tracking detects channel saturation before blended CAC metrics shift. Google and LinkedIn CPCs have risen 5-10% YoY, meaning flat budget allocation automatically produces declining productivity unless conversion rates improve equivalently.
CAC Payback Period Extension (Even With Stable LTV:CAC)
When payback lengthens from 12 to 15 months while headline LTV:CAC appears stable, either gross margin is silently compressing or early churn in new cohorts is increasing. Track Month 1 and Month 3 retention curves monthly — if newest cohorts retain at 92% vs 96% for prior cohorts, LTV for those cohorts will deteriorate 15% over the next 6-9 months.
Declining Net Revenue Retention (NRR)
Quarter-over-quarter NRR decline precedes LTV decline by several months because LTV incorporates forward-looking assumptions while NRR reflects actual historical behaviour. An NRR fall from 108% to 104% signals either expansion-revenue deceleration or early-churn acceleration — both predict future LTV compression. Snowflake's 130% → 127% NRR shift flagged growth moderation before ARR growth itself moderated.
Contribution Margin Compression by Cohort or Segment
A company can maintain 78% gross margin company-wide while specific segments or cohorts decline from 78% to 72% contribution margin. Track contribution margin by segment (SMB / mid-market / enterprise), product tier, and acquisition channel. Alert if any segment drops more than 2 percentage points quarter-over-quarter — this presages LTV erosion for that cohort.
Win Rate Compression and Pipeline Quality Decline
If win rate declines from 25% to 20%, sales teams typically respond by expanding the prospect pool, reducing qualification stringency, or increasing touchpoints to hit quota — all of which raise the cost of each closed deal. Track qualified opportunities per SDR per month, opportunity-to-close conversion, average sales cycle length, and average deal size. A 5-10% quarter-over-quarter decline in any of these predicts CAC or LTV deterioration 1-2 quarters out — the B2B sales pipeline automation architecture automates this detection.

How Do the Four Compounding Levers Lift LTV:CAC by 46-62%?
Unit economics is not a single metric to be optimised; it is a system of four interlocking levers where improvements compound. A 10% improvement across each lever creates a 46% LTV:CAC improvement due to multiplicative effects. Pull all four simultaneously over 12 months and the compounding can reach 62% or more.
Lever One — Pricing and ARPA Expansion via Value-Based Pricing. Most mid-market SaaS companies operate on cost-plus or competitor-based pricing, capturing only a fraction of value delivered. A shift to value-based pricing can increase ARPA by 10-20% without corresponding churn increase. McKinsey research cited in 2025 studies shows value-based pricing SaaS companies achieve 10-15% higher revenue growth compared to cost-plus peers. For a SaaS with 500 customers at $500 ARPA, a 15% ARPA lift to $575 raises LTV by 15% without changing churn or gross margin. Combine with ARPU optimisation across cohort segments to capture segment-specific willingness-to-pay.
Lever Two — Retention and NRR as LTV Multiplier. Since LTV scales inversely with churn (churn is the denominator), reducing monthly churn by 0.5 percentage points yields a 33% LTV increase. UserJot's analysis of 2,100+ SaaS companies (referenced in CRV's NRR research) shows companies with NRR above 110% grow 1.5-3x faster than companies with sub-100% NRR, and achieve 30-40% higher valuations. NRR expansion is the single most powerful lever available because it requires zero new CAC and directly multiplies LTV.
Lever Three — Acquisition Efficiency via Funnel Optimisation and Channel Mix Evolution. A 20% reduction in CAC without LTV decline yields a 20% improvement in LTV:CAC ratio. SEO delivers 5.8x more leads per dollar than PPC ($31 CPL vs $181 CPL), though it requires 6-12 months upfront investment before compounding returns materialise. Companies scaling past $10M ARR typically evolve toward organic discovery as the dominant new customer source. Paired with AI-driven revenue intelligence, sales cycle compression of 20-30% directly improves payback period and cash flow without changing headline CAC.
Lever Four — Fully-Loaded Cost Reduction via Operational Leverage and Agentic Automation. This is the most potent 2025-2026 lever. UserGems' 2026 AI SDR economics analysis shows AI-driven lead generation costs approximately $39 per qualified lead compared to $262 for human-generated leads — an 85% reduction. A mid-market SaaS with 4 human SDRs at $120K loaded cost each ($480K annually) can redeploy $150K toward AI SDR tooling and reduce CAC 30-40%. Payback for AI SDR investment is 3.2 months versus 8.7 months for hiring human SDRs. This is the infrastructure peppereffect installs inside AI sales agent systems and CRM automation architectures.
| Lever | Baseline | Improved | Lever Impact |
| ARPA (pricing) | $500/mo | $560/mo | +12% |
| Monthly Churn (retention) | 3.0% | 2.5% | -0.5pp (LTV +20%) |
| Fully-Loaded CAC (acquisition) | $2,000 | $1,700 | -15% |
| Gross Margin (operational leverage) | 78% | 80% | +2pp |
| LTV | $13,000 | $17,920 | +38% |
| LTV:CAC Ratio | 6.5:1 | 10.5:1 | +62% |
Source: Dossier modelled calculation based on Benchmarkit 2025, UserGems AI SDR economics, and Bessemer State of AI 2025
Installing the four levers manually takes 18-24 months of sequential optimisation. Installing them as an integrated AI operating system compresses that to 4-6 months.
Book a Growth Mapping CallHow Is Agentic Automation Restructuring CAC Economics?
Agentic automation — the deployment of AI-driven autonomous agents for repetitive high-volume business processes — is fundamentally restructuring CAC economics for mid-market SaaS companies in 2025-2026. This shift represents the most significant unit economics inflection since Product-Led Growth (PLG) emerged in 2015-2018.

Traditional SDRs spend 5-8 hours daily on email sequencing, LinkedIn outreach, research, meeting scheduling, and CRM administration, with only 20-30% of time on actual conversation. AI SDR agents (Gong Engage, Clari, Apollo Intelligence, UserGems AI) automate research, sequencing, and administration, freeing human SDRs to focus exclusively on high-touch conversations with qualified prospects. The economic impact: AI generates leads at $39 per qualified lead compared to $262 for human-generated leads — an 85% reduction with 24/7 operation, zero ramp time, and 10,000+ data points processed per second for signal detection.
For a mid-market SaaS with 4 human SDRs generating 200 qualified leads monthly ($262 CPL = $52,400 monthly cost), switching to AI-driven prospecting with 1 human SDR for quality control costs approximately $12,000 monthly ($39 CPL × 300 leads + $5,000 oversight). That is 77% cost reduction with 50% more leads. AI SDR agents also achieve response-time advantages (sub-1-minute response to inbound leads vs 8-24 hours for humans) that boost conversion rates by 391%.
Beyond SDR automation, automated sales operations adds another efficiency layer. Companies currently allocate 1-2 FTE to RevOps functions like CRM data hygiene, deal routing, opportunity assignment, and forecast management. AI-powered revenue intelligence platforms automate these workflows through automatic deal routing based on seller capacity, real-time forecast accuracy improvement, automated CRM updates from meeting transcripts, and predictive risk scoring. Apollo's research on SDR productivity shows teams consolidating to unified platforms achieve 30% productivity improvement — reducing fully-loaded CAC by 15-20% without headcount reduction.
Customer Success automation extends the impact to retention. AI-driven health scoring and automated engagement workflows allow a mid-market SaaS with 500 SMB customers at $150 ARPA to manage 400 customers at a 1:200 ratio with human CSM intervention only for high-risk accounts — reducing CS costs 40-50% while improving NRR 3-5 percentage points. This combined impact is why the 4-lever model above is achievable: automation is no longer a marginal improvement but a step-function restructuring of the fully-loaded cost base.
Key Takeaway
When all four agentic automation levers are deployed (SDR prospecting, sales ops, CS automation, billing automation), fully-loaded CAC drops from ~$2,100 to ~$1,260 — a 40% reduction that translates directly into LTV:CAC improvement from 3.8:1 to 5.3:1. Early adopters are creating a structural advantage that lagging competitors cannot close without rebuilding their entire go-to-market architecture.
What Board-Level Reporting Framework Exposes Hidden Decay?
The most sophisticated mid-market SaaS companies have developed board reporting frameworks that expose unit economics decay before headline P&L metrics signal problems. Five reporting practices distinguish elite operators from companies that discover problems through lagging indicators.
Cohort-level reporting of CAC, LTV, and payback by acquisition quarter reveals whether recent cohorts are performing worse than historical cohorts. A blended LTV:CAC of 3.8:1 might hide a declining trajectory: Q1 2024 at 4.1:1, Q2 at 4.0:1, Q3 at 3.7:1, Q4 at 3.4:1, Q1 2025 at 3.1:1. That trajectory predicts headline LTV:CAC falls below 3:1 by Q3 2025 — giving the CEO two quarters of lead time to intervene.
Separate tracking of Gross Revenue Retention (GRR) and Net Revenue Retention (NRR) by cohort exposes expansion compression. A company with stable NRR of 105% but declining GRR from 92% to 88% is experiencing expansion dressing up retention losses. Product adoption or expansion selling is stalling — NRR will follow GRR down within 1-2 quarters. Most board decks present only blended NRR, obscuring this deterioration.
Fully-loaded CAC reporting by acquisition channel reveals how channel mix shifts are inflating blended CAC even when individual channels are flat. If SDR-sourced revenue grows from 30% to 50% of new customer acquisition at $2,500 CAC versus $800 for paid search, blended CAC rises from $1,500 to $1,950 due to mix alone.
Rule of 40 decomposition by unit economics inputs separates genuine efficiency from cost-cutting. A company with 25% growth + 15% EBITDA margin = 40 score appears healthy. But if underlying LTV:CAC is declining from 4:1 to 3:1, the growth is unsustainable. If Rule of 40 is rising while LTV:CAC is falling, the profitability improvement is from S&M cuts rather than true efficiency — and growth will slow in future quarters.
Communication norms for board discussion frame deterioration around trends and corrective action rather than defending stable metrics. "LTV:CAC declined from 4.2:1 to 4.0:1 quarter-over-quarter due to a 15% increase in CAC as we scaled outbound channels. To maintain Rule of 40 trajectory, we are implementing three initiatives: AI SDR automation to reduce fully-loaded CAC by 25%; expansion revenue acceleration to improve NRR from 105% to 110%+; and pricing optimisation to increase ARPA by 10% while maintaining conversion rates." This framing acknowledges the deterioration, explains root cause, and articulates a corrective plan — far more credible than defending stable metrics while structural efficiency erodes.
Frequently Asked Questions
What is a good LTV:CAC ratio for SaaS in 2026?
For mid-market B2B SaaS in the $10-40M ARR band, the canonical 3:1 ratio remains the absolute minimum threshold for sustainable economics, but 2025-2026 data shows top-quartile performers achieving 4:1 to 5:1 ratios. Elite AI-native or high-expansion-revenue companies reach 6:1 or higher. A ratio below 2:1 signals that you are paying more to acquire customers than those customers will ever generate in gross profit — a business model that cannot scale without subsidised growth capital. A ratio above 6:1 may indicate underinvestment in growth rather than exceptional efficiency. The sustainable zone for mid-market sits between 3:1 and 5:1, with 4:1 representing the new healthy threshold for scale-stage companies.
How do I calculate fully-loaded CAC correctly?
Start with direct marketing spend (paid ads, content production, events), then add fully-loaded sales compensation (80% of SDR comp allocated to new business, not 100%), sales tooling per rep ($20,000+ annually for Salesforce, Outreach, HubSpot, ZoomInfo), marketing tooling, creative production, RevOps salary allocation, and allocated facilities overhead for the sales team. Divide by new customers acquired in the period. Publish three CAC figures to your board: Paid CAC (ad spend only) for channel comparison, Blended CAC (including sales comp and tools), and Fully-Loaded CAC (including RevOps and overhead allocation) for true unit economics. The gap between Paid CAC and Fully-Loaded CAC is typically 2-3x — exposing it is the first step to disciplined reporting.
What is the difference between GRR and NRR, and why does it matter?
Gross Revenue Retention (GRR) measures pure retention without expansion — it can never exceed 100% because it only counts retention losses (churn + downgrades). Net Revenue Retention (NRR) adds expansion revenue from upsells, cross-sells, and seat expansion, so NRR can exceed 100%. The distinction matters because a company with stable NRR at 105% but declining GRR from 92% to 88% is experiencing expansion revenue masking underlying retention deterioration. Track both metrics monthly by cohort. GRR decline is the leading indicator — NRR decline follows 1-2 quarters later when expansion cannot offset accelerating churn.
How can AI automation reduce my CAC?
AI-driven SDR agents generate qualified leads at approximately $39 per lead compared to $262 for human-generated leads — an 85% reduction. A mid-market SaaS with 4 human SDRs can redeploy budget toward AI SDR platforms (Gong, Clari, Apollo, UserGems) and reduce fully-loaded CAC by 30-40% while also improving lead quality and response times. Payback for AI SDR investment is 3.2 months compared to 8.7 months for hiring human SDRs. Beyond SDRs, automated sales operations reduce RevOps overhead 20-30%, customer success automation reduces CS costs 40-50% for SMB cohorts, and billing automation cuts financial operations overhead 20%. Combined, these levers can deliver a 40% fully-loaded CAC reduction in 6 months when installed as an integrated system rather than point tools.
How often should I track unit economics metrics?
Headline metrics (LTV:CAC ratio, CAC payback, gross margin, NRR) should be tracked monthly at minimum, with quarterly board-level reporting. Leading indicators require higher frequency: cost-per-lead by channel weekly, Month 1 and Month 3 cohort retention monthly, pipeline quality (win rate, conversion rate, average deal size) weekly. Most mid-market SaaS companies track headline metrics quarterly only — which means they discover deterioration 6-9 months after it starts. Elite operators track leading indicators weekly and adjust acquisition, retention, and pricing levers in near-real-time. This is an operational discipline enabled by autonomous agentic reporting infrastructure that surfaces signal from noise across cohorts, segments, and channels.
What is the "Rule of 40" and how does it relate to unit economics?
Rule of 40 is the growth-plus-profitability benchmark: revenue growth rate + profit margin should exceed 40%. A company with 25% growth and 15% EBITDA margin scores 40, signalling healthy balance between growth investment and profitability. But Rule of 40 can mask underlying unit economics deterioration. If a company improves Rule of 40 from 35 to 42 by cutting S&M spend while LTV:CAC declines from 4:1 to 3:1, the profitability gain is from cost reduction rather than efficiency improvement — and growth will slow in future quarters as the pipeline starves. Track Rule of 40 alongside LTV:CAC and CAC payback as a system: rising Rule of 40 with stable or improving LTV:CAC signals sustainable efficiency; rising Rule of 40 with declining LTV:CAC signals a future growth collapse.
How does NRR above 110% create a valuation premium?
Net Revenue Retention above 110% means existing customers expand faster than they churn or downgrade — creating a compounding revenue engine where installed base growth alone can sustain company-level growth with zero new customer acquisition. Companies with NRR above 110% grow 1.5-3x faster than peers with sub-100% NRR and achieve 30-40% higher valuation multiples. Elite operators (Datadog, Atlassian, Snowflake) maintain NRR of 120-130%+ — eventually their expansion revenue exceeds new customer revenue. For mid-market SaaS, the practical levers to push NRR above 110% include dedicated expansion sales teams (separate from retention CSMs), feature tiering that unlocks as adoption increases, usage-based overages that auto-expand customers, and workflow integration that increases switching cost. The combination typically lifts NRR from 105% to 112-115% over 12-18 months.
Install the Unit Economics Operating System Your $10-40M ARR Business Needs to Compound
peppereffect architects the integrated AI operating system that pulls all four compounding levers simultaneously — value-based pricing infrastructure, expansion-revenue automation, agentic acquisition, and fully-loaded cost reduction. Mid-market B2B SaaS companies installing the Freedom Machine achieve 46-62% LTV:CAC improvement in 12 months without proportional headcount growth.
Book a Growth Mapping CallExplore the AI for SaaS Playbook → SEO content marketing systems five-lever decoupling framework SaaS CEO metrics capital path decision framework
Resources
- Benchmarkit — 2025 SaaS Performance Metrics Report
- Bessemer Venture Partners — The State of AI 2025
- CloudZero — SaaS Gross Margin Benchmarks: What To Track In 2025
- CRV — What Is Net Revenue Retention (NRR)? Formula & Benchmarks
- First Page Sage — Average CAC for Startups: 2026 Benchmarks
- Bantrr — CAC Payback Benchmarks for SaaS Companies
- G-Squared CFO — SaaS Benchmarks: 5 Performance Benchmarks for 2026
- UserGems — AI SDR Cost Analysis vs Human SDR Economics


