

What Is Net Revenue Retention (NRR) and Why Does It Matter?
Net Revenue Retention (NRR) is the single most predictive SaaS metric of long-term growth, valuation multiples, and capital efficiency. It measures how much recurring revenue you keep and expand from your existing customer base over a defined period — typically twelve months — after accounting for churn, contraction, and expansion. If your NRR sits above 100%, your existing book of business grows on its own, even if you never acquire a new logo. If it drops below 100%, you are running a leaky bucket and every new customer acquisition is doing double duty: replacing churn and trying to grow the top line.
The 2025 SaaS benchmark data tells a stark story. According to Benchmarkit's 2025 B2B SaaS Performance Benchmark Report, the median NRR across private SaaS companies sits at 101%. Top-quartile operators clear 120%. Companies below 100% face a compounding drag that no amount of new-logo acquisition can repair at reasonable CAC. For Sarah Chen's mid-market B2B SaaS peers — the $10M-$40M ARR cohort trying to reach $50M without doubling headcount — this is the difference between a funded growth story and a down round.
What you'll learn in this pillar:
- The exact NRR formula, with worked examples and the four variants investors actually care about
- How NRR differs from NDR and GRR — and why confusing them costs you valuation
- 2025 benchmarks by ARR band, pricing model, and customer segment
- The compounding math that shows why a 25-point NRR delta becomes £14M+ in five years
- Seven specific failure modes that silently drag NRR below 100% — and the agentic systems that prevent each one
- The expansion motion architecture used by Snowflake, Monday.com, and Figma to hit 130%+ NRR
Key Takeaway
NRR above 115% is the single strongest predictor of a Series B-to-C valuation uplift in 2026 B2B SaaS. Companies clearing 120% grow 83% faster than the median and command 2-2.5x higher ARR multiples at exit. Every lever that improves NRR — onboarding, adoption, expansion triggers, churn prevention — is a leverage point that decouples revenue growth from new-logo CAC.

How Do You Calculate Net Revenue Retention?
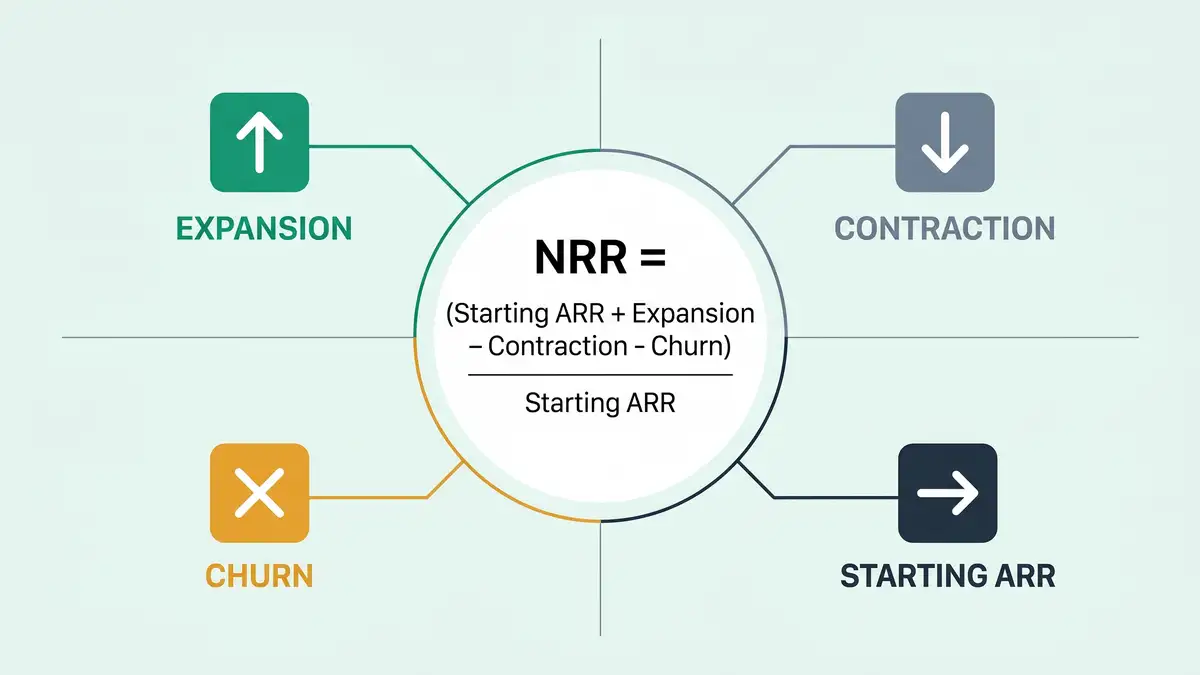
The standard NRR formula measures the recurring revenue evolution of a fixed customer cohort over a twelve-month window. You take the starting ARR of a cohort, add expansion (upsells, cross-sells, and price increases), subtract contraction (downgrades) and churn, and divide by the starting ARR. New logos acquired during the period are explicitly excluded — NRR is a retention metric, not a growth metric.
The canonical formula is:
NRR = (Starting ARR + Expansion - Contraction - Churn) / Starting ARR × 100%
Consider a worked example. A SaaS company starts 1 April 2025 with £10,000,000 in ARR from 250 customers. Over the next twelve months, existing customers expand by £2,400,000 (seat additions, tier upgrades, cross-sell modules). Five customers downgrade for a total of £480,000 in contraction. Twelve customers churn entirely, representing £720,000 in lost ARR. The NRR calculation: (10,000,000 + 2,400,000 - 480,000 - 720,000) / 10,000,000 = 112%. This is a healthy number — above the 101% median but below the 120% top-quartile threshold.
There are four variants of this formula, and the one you quote materially affects how investors value your business SaaS financial model.
| Variant | What It Measures | When It Is Used |
| Standard NRR (ARR-weighted) | Revenue evolution of the cohort by dollars | Board reporting, investor decks, public disclosure |
| Customer-weighted NRR | Average NRR per logo, treating each customer equally | Segment analysis, customer-success scorecards |
| Cohort NRR | NRR tracked for one acquisition cohort over time | LTV modeling, onboarding efficacy |
| Trailing Twelve Months (TTM) NRR | Rolling 12-month window updated monthly | SaaS-native boards, real-time monitoring |
Sources: SaaS Magazine — Defining NRR, Benchmarkit 2025 B2B SaaS Benchmarks
Most mid-market CFOs default to ARR-weighted standard NRR, which is the number public SaaS companies report and the one Series B+ investors benchmark against. Customer-weighted NRR is a useful diagnostic — if your ARR-weighted number is 115% but your customer-weighted number is 92%, you have a handful of whales carrying the business and a long tail of underwater accounts that will eventually churn.
The 4 Pillars Playbook breaks down the entire framework with deployment maps, KPIs, and real case studies across SaaS, recruiting, and coaching.
Open the Interactive PlaybookNRR vs NDR vs GRR: What Is the Difference?
Net Dollar Retention (NDR) and Net Revenue Retention (NRR) are the same metric with two names — used interchangeably by most analysts but applied with subtle regional and financial-reporting differences. US SaaS companies and most public filings favour NDR; European and APAC reporting leans toward NRR. Both measure the same thing: net revenue evolution of existing customers including expansion and excluding new logos.

Gross Revenue Retention (GRR), however, is a fundamentally different metric — and the one Sarah Chen's investors scrutinise hardest. GRR measures only the downside: how much of your starting ARR you retain after churn and contraction, with expansion explicitly excluded. The formula is (Starting ARR - Contraction - Churn) / Starting ARR. Because expansion is stripped out, GRR is capped at 100%. A healthy GRR sits at 90%+ for mid-market SaaS and 95%+ for enterprise.
Why the distinction matters: NRR above 100% can mask underlying retention weakness. A company can report 115% NRR while losing 18% of its customer base each year — the expansion from the remaining 82% is simply large enough to paper over the churn. Investors who only see NRR miss this. Sophisticated investors always ask for GRR alongside NRR, and the gap between them tells them whether your expansion machine is compensating for a retention problem or genuinely multiplying a healthy customer base. According to Sandbank's 2025 B2B SaaS benchmarks, the median SaaS company posts NRR of 101-102% against GRR of 90% — a 10-12 point gap that reflects healthy expansion compensating for moderate churn.
Want to see your own CAC against peer benchmarks? Run the CAC Diagnostic for your true CAC, the 30 to 50% reduction agentic deployment delivers, and a board-ready PDF in 60 seconds.
Run the CAC DiagnosticWhat Is a Good NRR in 2025 — and How Do the Benchmarks Break Down?
A "good" NRR depends entirely on your ARR band, customer segment, and pricing model — the median is not the benchmark Sarah Chen's board should care about. The headline number — 101% median across private B2B SaaS — masks a 30-point spread between segments. Enterprise SaaS targeting £100k+ ACV sits at 118% median; SMB SaaS at sub-£10k ACV struggles to clear 97%. Bootstrapped companies in the £3M-£20M ARR range land at 104%, meaningfully above the venture-backed median because their product-market fit tends to be tighter before they scale.
The complete 2025 benchmark breakdown, pulled from Optifai's B2B SaaS NRR benchmark analysis and cross-referenced against Wudpecker's 2025 retention benchmarks, looks like this:
| Segment | Median NRR | Top Quartile | Healthy GRR |
| Enterprise (£100k+ ACV) | 118% | 130%+ | 95%+ |
| Mid-Market (£10k-£100k ACV) | 108% | 120%+ | 90%+ |
| SMB (<£10k ACV) | 97% | 110%+ | 85%+ |
| Bootstrapped (£3M-£20M ARR) | 104% | 118%+ | 88%+ |
| Public SaaS (Top Performers) | 115% | 140%+ | 92%+ |
Sources: Optifai 2025 NRR Benchmarks, Wudpecker 2025 Retention Report, SaaS Capital Bootstrapped Benchmarks
Public SaaS leaders set the upper bar. Snowflake historically operates at 165-170% NRR — the gold standard, driven by usage-based pricing that scales automatically with customer data volume. Monday.com reports 140-145% NRR on tier-based seat expansion. Datadog hovers at 120-123% on usage-based observability pricing. CrowdStrike lands at 115-120% through module cross-sell in its endpoint security platform. HubSpot — the closest pure-play mid-market comparable for Sarah Chen — sits at 105-110%, with expansion driven by hub tier upgrades and contact-tier price adjustments. ServiceNow operates at 110-115%. Zoom, post-pandemic, has contracted to 95-105% as enterprise seat expansion has slowed.
The pattern is unmistakable: pricing model is destiny. Pure seat-based SaaS struggles to clear 120% NRR because expansion requires customer hiring. Usage-based pricing structurally expands with customer success — if your customers grow, your revenue grows, without you having to sell them anything. Tiered pricing sits in the middle.
We measure how often ChatGPT, Gemini, Claude and Perplexity cite you, then size the pipeline you are leaving on the table, against your revenue.
See what my AI visibility is worth →How Much Is NRR Actually Worth? The Compounding Math
A 25-point NRR gap compounds to £14.67M in incremental cumulative revenue over five years expansion revenue motion on a £10M starting ARR. This is not a rounding error. It is the difference between a Series B raise at 10x ARR SaaS growth strategy benchmarks and a down round, between hiring 40 engineers and cutting payroll, between an acquisition offer and a distressed sale.
The math is simple and unforgiving. Take three companies, each starting Year 1 with £10M ARR. Company A runs at 95% NRR. Company B runs at the 2025 median of 108%. Company C runs at the top-quartile 120%. Assume zero new-logo acquisition across all three — pure NRR compounding. Here is what Year 5 looks like:
| Year | Company A (95% NRR) | Company B (108% NRR) | Company C (120% NRR) |
| Year 1 Start | £10.00M | £10.00M | £10.00M |
| Year 2 Start | £9.50M | £10.80M | £12.00M |
| Year 3 Start | £9.03M | £11.66M | £14.40M |
| Year 4 Start | £8.57M | £12.60M | £17.28M |
| Year 5 End | £7.74M | £14.69M | £24.88M |
| Cumulative Revenue | £42.85M | £59.75M | £78.56M |
Source: SaaS Capital — Private SaaS Growth Rate Research (high-NRR companies grow 83% faster than peers Rule of 40 framework)
The gap between Company A and Company C is £35.71M in cumulative revenue across five years — on an identical starting base and zero new-logo acquisition. Layer in new-logo growth proportional to retention health (the same research from SaaS Capital shows high-NRR companies grow new-logo ARR 83% faster than low-NRR peers) and the compounded gap exceeds £100M across the same five-year window.
The Valuation Impact
At Series B-to-C valuations in 2026, companies posting NRR above 120% command 2-2.5x higher ARR multiples than companies below 100% SaaS margins benchmarks. On a £20M ARR base, that is the difference between a £100M and £250M enterprise value — a £150M delta driven entirely by retention math. Every point of NRR above 100% is, effectively, a compounding valuation premium.

Why Do Most B2B SaaS Companies Have NRR Below 100%?
Seven specific failure modes silently drag NRR below 100% — and most of them are operational, not strategic. A company doesn't lose 5 points of NRR because its product is wrong. It loses 5 points because its onboarding is slow, its expansion triggers are manual, its customer success team is firefighting instead of engineering, and its churn prediction runs on quarterly gut-feel rather than real-time signals. Each of these is a systems problem — which means each is solvable by installing the right agentic workflow layer.
The seven failure modes, ranked by NRR drag:

1. Slow time-to-value in onboarding. Customers who do not reach their first "aha" moment within 14-21 days churn at 3x the rate SaaS onboarding best practices of customers who do. Automated onboarding systems with logic-gated milestones (setup completion, first workflow executed, first value event triggered) eliminate the human bottleneck that delays activation.
2. Invisible expansion signals. A customer approaching a seat limit, consuming 80% of their included usage, or using three adjacent modules is an expansion candidate. Most customer success teams catch these signals in quarterly business reviews — two quarters after the expansion window has closed. Agentic monitoring systems catch them in real time.
3. Reactive churn response. By the time a customer signals intent to cancel, the deal is usually lost. Leading indicators — login frequency drop, feature-usage decline, stakeholder departure from the customer's org — precede churn by 60-90 days. Systems that monitor these signals and trigger save motions before the cancellation email arrives recover 30-40% of at-risk revenue.
4. Manual QBR cadence. Quarterly business reviews consume customer-success time customer success metrics that should be spent on expansion motions. Automated QBR generation from product-usage and billing data frees 60-70% of CSM capacity for strategic expansion conversations.
5. Disconnected billing and product systems. When billing and product data live in separate systems, identifying expansion opportunities (a customer who bought Tier 2 but uses Tier 4 features) requires manual analysis. Integrated CRM automation systems surface these opportunities automatically.
6. No structured win-back motion. Churned customers are three times more likely to return than a cold prospect is to convert. Most SaaS companies have no formal win-back sequence. An automated 90-day re-engagement workflow recovers 5-12% of churned revenue.
7. Pricing and packaging misalignment. If your pricing tiers don't map to customer value realisation, expansion requires a sales cycle B2B pricing strategy. Usage-based or consumption pricing removes the friction — customers expand automatically as their usage grows, and you capture that expansion without a single sales touch.
Avoid This Mistake
Do not try to fix NRR by hiring more CSMs. This is the most common — and most expensive — mistake Sarah Chen's peers make. Adding customer success headcount to a broken system simply scales the manual chaos. Every £1 spent on CSM headcount below the system-fix threshold returns £0.40 in retained revenue. The same £1 spent on onboarding automation, expansion triggers, and churn prediction returns £3.80-£5.20. Fix the operating system first.
Ready to diagnose which of these seven failure modes is costing you the most NRR? Book a Growth Mapping Call and we will identify the highest-leverage operational fix for your specific ARR band and pricing model.
Book Your Growth Mapping CallHow Do Top-Quartile SaaS Companies Build a 120%+ NRR Expansion Motion?
Companies that sustain 120%+ NRR share three architectural decisions: a pricing model that expands with customer value, an agentic expansion-signal layer, and a customer success function that runs as an operational engine rather than a reactive service desk. They do not have better salespeople. They have better systems. According to OpenView's 2024 SaaS benchmarks analysis, the best-performing SaaS companies report NRR of 110%+ and are disproportionately represented among usage-based pricing adopters.
The expansion motion architecture breaks into five deployable stages:
Install a Usage Signal Layer
Instrument every product action that correlates with customer value realisation. Track feature adoption, workflow completion rates, seat utilisation, and API call volume. This data becomes the raw input for every subsequent expansion motion. Without it, expansion decisions are guesses.
Define Expansion Triggers as Logic Gates
An expansion trigger is a measurable threshold — "customer has used 80% of seat allocation for 14 consecutive days" — that fires a defined workflow. Build 8-12 of these, each mapped to a specific expansion motion (seat addition, tier upgrade, module cross-sell, overage pricing conversation).
Automate the Expansion Workflow
When a trigger fires, the workflow runs without human delay. Seat overages generate an automated invoice. Tier upgrades surface a personalised in-product nudge. Module cross-sells route to the assigned CSM with a pre-built brief, not an empty calendar invite. Agentic workflows compress expansion cycles from 45 days to 7.
Install a Churn Prediction Layer
In parallel, monitor leading churn indicators — login decline, feature disengagement, support ticket sentiment, billing disputes — and trigger save motions before the customer initiates cancellation. Leading SaaS operators catch 60-70% of at-risk customers 45-90 days before the decision event.
Measure NRR Weekly, Not Quarterly
Boards that review NRR quarterly are three months behind. Best-in-class SaaS operators report cohort NRR on a weekly rolling basis, broken down by expansion source, segment, and acquisition vintage. This cadence surfaces emerging problems before they become board-level crises.
The public-company playbook confirms the architecture. Snowflake's 165-170% NRR is not the result of superior salesmanship — it is the natural outcome of usage-based pricing that captures customer data growth automatically. Monday.com's 140-145% NRR derives from a tier-and-seat combination where each new team onboarded expands the account. Figma's pre-acquisition NRR, also in the 140%+ range, reflected seat-based expansion coupled with disciplined tier packaging. Each of these companies engineered their expansion into the product architecture rather than leaving it to the sales floor.
How Does AI Automation Change the NRR Equation in 2026?
Agentic AI transforms NRR from a labour-intensive customer success function into a logic-gated operating system that runs autonomously across expansion, retention, and churn prevention. The customer success platforms built between 2015 and 2023 — Gainsight, ChurnZero, Catalyst, Totango, Custify — were dashboarding systems. They surfaced data so that humans could act. The next generation, built on agentic workflows, acts on the data directly.
The five AI-deployable shifts in the NRR operating system:
| Workflow | Pre-AI Approach | Agentic Approach | Hours Reclaimed / 100 Customers |
| QBR Preparation | CSM manually pulls usage + billing data for 4 hours per QBR | Auto-generated QBR briefs with anomaly flagging | 180-220 hours/quarter |
| Expansion Triggering | Quarterly review catches opportunities 2 quarters late | Real-time trigger-based motions | 50-80 hours/month |
| Churn Prediction | Reactive response to cancellation notices | Proactive save motions 45-90 days early | 30-50 hours/month + 30-40% recovery uplift |
| Onboarding Execution | CSM-led with 14-21 day time-to-value | Automated logic-gated milestones, 5-7 day TTV | 60-90 hours/onboarding cohort |
| Renewal Conversations | Cold outreach 60 days pre-renewal | Warm, value-anchored renewal workflows | 25-40 hours/month |
Sources: High Alpha 2025 SaaS Benchmarks, Burkland 2025 SaaS Benchmarks Analysis
The compounding effect is significant. A 100-customer SaaS business running the agentic NRR stack reclaims 350-480 hours per month across its customer success function. That capacity can be redeployed toward strategic expansion conversations with top-quartile accounts — the ones where a human touch genuinely moves the needle. Meanwhile, the mid-tail and long-tail accounts run on automation and deliver NRR contribution that previously required a dedicated CSM to manage.
For Sarah Chen scaling from £20M to £50M ARR without doubling headcount, this is the operational unlock. An agentic NRR layer decouples retention performance from customer success headcount in exactly the same way that automated sales automation systems decoupled lead generation from SDR headcount five years earlier. The result is structural margin expansion — the best kind.
Frequently Asked Questions
What is a good net revenue retention rate for mid-market B2B SaaS?
A good NRR for mid-market B2B SaaS (£10k-£100k ACV) is 108% or higher, with top-quartile operators clearing 120%. The 2025 median across private SaaS companies sits at 101% per Benchmarkit's report, but mid-market specifically skews higher because of better expansion motions on larger account sizes. Sarah Chen's peer companies targeting Series B or C raises in 2026 should aim for 115%+ as the credibility threshold — below that number, valuation conversations become defensive. The metric that matters more than your absolute NRR is your trajectory: a company growing NRR from 105% to 118% over 18 months is more investable than a company flat at 120%. For more on the operational levers, see our analysis of ARPU as a SaaS growth metric.
How do you calculate net revenue retention?
NRR = (Starting ARR + Expansion - Contraction - Churn) / Starting ARR × 100%. The calculation is run on a defined customer cohort over a twelve-month window, and new logos acquired during the period are excluded. Most investor-grade reporting uses ARR-weighted standard NRR on a trailing twelve-month basis, updated monthly. A company starting with £10M ARR that sees £2.4M in expansion, £480k in contraction, and £720k in churn posts 112% NRR. The critical nuance: your calculation must use the same customer cohort at the beginning and end of the period. If you accidentally include new logos, you're measuring total revenue growth, not retention.
Does net revenue retention include new customers?
No. NRR explicitly excludes customers acquired during the measurement period. The metric measures how much recurring revenue you retain and expand from a fixed starting cohort over twelve months. New logos contribute to ARR growth, but they do not affect the NRR calculation. This distinction matters because NRR is investors' purest signal of product-market fit and post-sale operational health — if you buy NRR by aggressive new-logo acquisition, you contaminate the signal and inflate the number beyond its useful meaning. Companies that conflate the two often report inflated NRR figures that collapse under diligence.
What is the difference between gross revenue retention and net revenue retention?
GRR measures only the downside — how much starting ARR you retain after churn and contraction, with expansion excluded. NRR includes expansion, so it can exceed 100%. GRR is capped at 100%. A healthy mid-market SaaS reports GRR of 90%+ alongside NRR of 108%+. The gap between them is the contribution of expansion to total retention. If GRR is 88% and NRR is 118%, expansion is compensating for 12 points of churn — which is a warning sign even though the headline NRR looks strong. Sophisticated investors always review both numbers together. A company with NRR 115% and GRR 95% is healthier than one with NRR 120% and GRR 82%, even though the latter has a higher NRR.
What is a good net dollar retention rate?
NDR and NRR are the same metric with different names — "Net Dollar Retention" is the terminology US-based SaaS and public filings typically use, while "Net Revenue Retention" is more common in European and APAC markets. The benchmarks are identical: 101% median, 120%+ top quartile. Public SaaS leaders like Snowflake (165-170%), Monday.com (140-145%), and CrowdStrike (115-120%) report the metric as NDR. When comparing companies across reports, treat NRR and NDR as directly equivalent — the formula and cohort methodology are the same. Some analysts use NDR specifically when referring to ARR-weighted calculations and NRR when referring to customer-weighted variants, but this distinction is not consistent across sources.
Can gross retention be over 100%?
No. GRR is mathematically capped at 100% because it excludes expansion revenue. The formula — (Starting ARR - Contraction - Churn) / Starting ARR — can only produce 100% if no customer churns or downgrades, and cannot exceed 100% under any scenario. If you see a report claiming GRR above 100%, it is either mis-labeled (actually NRR) or misformulated. This cap is why GRR is useful as a pure retention quality signal: it isolates the downside from expansion effects and gives investors a clean read on how sticky your base product is before any upsell motion is applied.
How often should you measure and report NRR?
Best-in-class SaaS operators measure NRR on a weekly rolling trailing-twelve-month basis, broken down by customer segment, acquisition cohort, and expansion source. Board-level reporting happens monthly or quarterly, but the internal operational cadence should be weekly — waiting for the quarter-end review means expansion opportunities and churn risks are already 60-90 days stale when the board sees them. The dashboard that matters most segments NRR by cohort (customers acquired in Q1 2024 versus Q1 2025), because cohort-level NRR tells you whether onboarding and early-life retention are improving or deteriorating. Blended NRR can hide cohort-level problems that predict future churn waves.
Install Your NRR Operating System
Every point of NRR above 100% is compounding valuation premium — and every point below is compounding drag. peppereffect architects the agentic NRR layer for mid-market B2B SaaS: onboarding automation, expansion triggers, churn prediction, and renewal workflows integrated as a logic-gated operating system. Decouple retention performance from headcount. Install the Freedom Machine.
Book Your Growth Mapping CallRead: Sales Automation for B2B SaaS → customer health score architecture churn diagnostic playbook LTV to CAC ratio
Keep architecting: related systems and tools
Free tools: pressure-test the metrics NRR compounds with using the revenue per employee calculator, the ARPU calculator, and the 2026 B2B SaaS benchmark dataset.
Install the systems: 120%+ NRR is built by automating the expansion motion. Deploy sales administration and CRM automation and AI customer success operations, backed by AI lead generation systems. See the AI for SaaS playbook.
Resources
- Benchmarkit 2025 B2B SaaS Performance Benchmark Report — 101% median NRR across private SaaS
- Optifai B2B SaaS NRR Benchmarks — Enterprise 118%, Mid-Market 108%, SMB 97%
- Wudpecker 2025 B2B SaaS Retention Benchmarks — 2025 median 106%, top 120%+
- Sandbank B2B SaaS Benchmarks — NRR 101-102%, GRR 90%
- SaaS Capital — Private SaaS Growth Rate Research (high-NRR grow 83% faster)
- SaaS Capital Bootstrapped Benchmarks — £3M-£20M ARR median NRR 104%
- High Alpha 2025 SaaS Benchmarks — 9th annual industry report
- Burkland 2025 SaaS Benchmarks Analysis — What Great Looks Like
- OpenView 2024 SaaS Benchmarks Webinar — 110% median NRR top performers
- SaaS Magazine — Defining Net Revenue Retention


