

For mid-market B2B SaaS CEOs, the pricing conversation is still treated as a finance exercise run once a year by a junior analyst. The data says otherwise. A 1% improvement in price realization delivers an 11% gain in operating profit — more than three times the leverage of a 1% volume increase and nearly double a 1% cost reduction (PriceAgent, McKinsey analysis, 2026). Yet the median B2B SaaS company spends fewer than six hours per year on pricing strategy and re-evaluates pricing less than once every 18 months. SaaS pricing page optimization
This guide deconstructs B2B pricing strategy for the Sarah Chen archetype — CEOs running $10M–$40M ARR companies who need to expand margin without expanding headcount. We cover the four-frame pricing taxonomy, the five margin-killing mistakes to engineer out of your model, the 2025–2026 shift toward hybrid, usage-based, and AI-agent pricing, and the willingness-to-pay research methods that produce defensible decisions. Every recommendation is calibrated for the mid-market operator who needs to move in 90 days, not 18 months.
The Executive Summary
Pricing is the single highest-ROI lever available to mid-market B2B SaaS CEOs. With CAC payback deteriorated to 20 months median and 60% of new ARR at $50M+ companies coming from existing customers, the pricing architecture — not top-of-funnel volume — determines margin. The 2025–2026 winners will combine a predictable subscription base with usage or outcome tiers, discipline discounting with ROI gates, and re-evaluate pricing every 6–9 months rather than annually.
The Pricing Profit Lever: Why This Is the Highest-ROI Work You Can Do
The case for prioritizing pricing rests on a calculation every CFO understands but few CEOs operationalize: the profit elasticity of price changes vastly exceeds cost or volume moves. Holding volume constant, a 1% price increase lifts operating profit by 11% according to McKinsey analysis, with Deloitte's work pushing that figure as high as 12.3% (PriceAgent, 2026). A 1% reduction in variable cost yields ~6.7% profit improvement; a 1% volume gain yields just 3.6%. Price flows directly to the bottom line without triggering corresponding operational costs — the reason Hermann Simon's foundational work calls pricing "the most effective driver of profit" (Confessions of the Pricing Man).
The Simon-Kucher Global Pricing Study 2025 documents that among the 86% of companies that grew revenue in 2024, pricing contributed materially to margin expansion — but realized price capture has dropped to 43%, indicating that discount leakage is eroding value even as list prices inch up (Simon-Kucher, 2025). Only 28% of companies increased prices in 2024, and merely 24% plan price increases above inflation in 2025. For a Sarah Chen operating at $10M–$40M ARR, this is a gift: your competitors are under-pricing, and your buyers are anticipating price movement. The window is open.

The gap between pricing importance and pricing investment is the modal dysfunction. Patrick Campbell, analyzing more than 30,000 subscription companies at ProfitWell, observed that most B2B SaaS founders spend fewer than six hours per year on pricing across the entire life of their company — a fraction of the time invested in hiring, marketing, or product roadmap (PLG Pricing Metrics analysis, 2026). For mid-market operators, this under-investment is compounding the worst moment in recent SaaS history: median CAC payback has deteriorated to 20 months, up from a historical 12–14 months, per the 2025 RockingWeb/BenchmarkIt 936-company benchmark.
Why Mid-Market Is Disproportionately Exposed
The $10M–$40M ARR operator faces a specific pricing problem that $1B enterprises and sub-$5M startups do not. You are large enough that pricing errors compound into meaningful margin drag, but small enough that you cannot absorb a pricing research misstep the way a mature enterprise can. You need to expand net revenue retention above 110%, defend ARPU, and hit the expansion math that determines whether your Series C is a priced round or a flat one. High Alpha's 2025 research shows companies over $50M ARR now generate ~60% of new ARR from existing customers — pricing architecture, not new logo acquisition, is the determining lever (High Alpha 2025 SaaS Benchmarks).
The SaaS Capital benchmark for bootstrapped $3M–$20M ARR companies shows median NRR at 104% with 90th percentile at 118% — a 14-point gap that is almost entirely pricing architecture, not product quality. OpenView research cited by industry analyses finds that companies using hybrid pricing models report 38% higher NRR than pure subscription firms. For our Sarah Chen, that gap is the difference between hitting a $50M ARR target in 36 months versus 54 months — with the same product, the same team, and roughly the same sales motion.
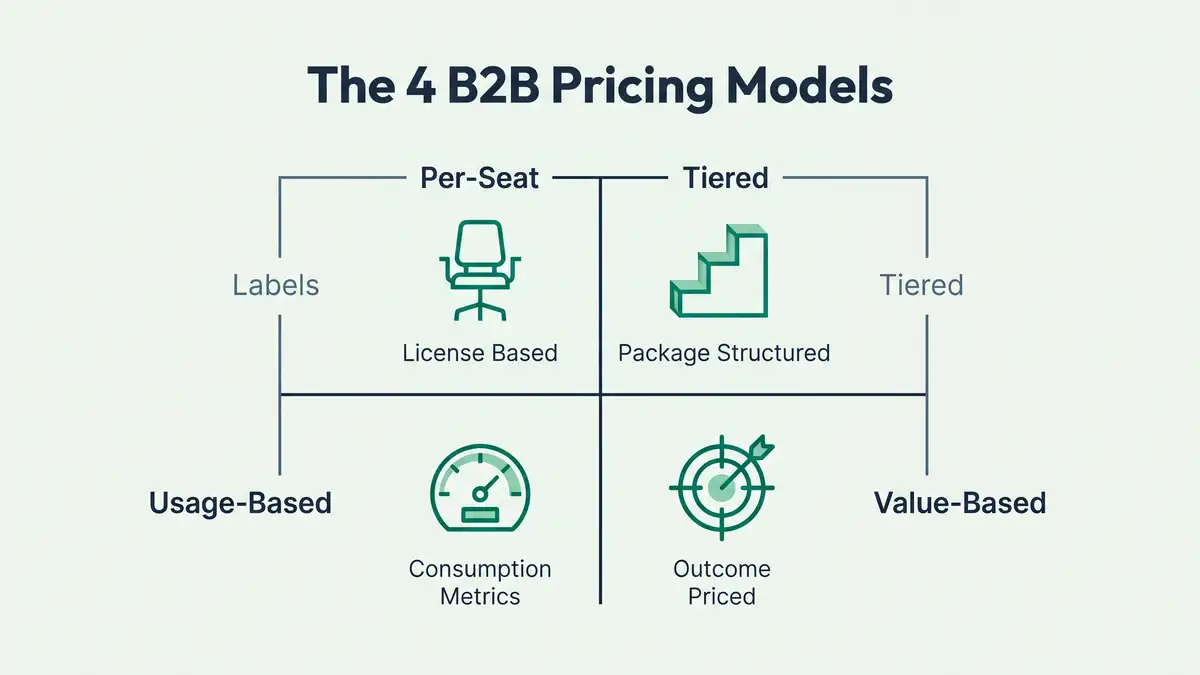
The Four-Frame B2B Pricing Model Taxonomy
The modern B2B SaaS pricing landscape decomposes cleanly into four architectural frames, each with distinct unit economics and customer psychology. The frames are not mutually exclusive — 61% of SaaS companies now run hybrid combinations, up from 49% in 2024 (2026 Guide to SaaS AI Pricing). Understanding each frame in isolation is the prerequisite to choosing the right combination.
| Frame | Primary Metric | Adoption | NRR Profile | Best Fit |
| Per-Seat | User/license count | 57% (down from 64% in 2024) | 100–105% | Collaboration tools, legacy enterprise |
| Tiered Feature-Based | Plan tier (3 tiers optimal) | ~70% use some tiers | 105–115% | Mid-market with clear segment differentiation |
| Usage-Based | API calls, tokens, storage, transactions | 85% have some element; 46% primary | 110–130% | Developer tools, infrastructure, AI-native |
| Value/Outcome-Based | Tickets resolved, revenue generated | 40% target by 2025 (Gartner) | 115–140% | AI agents, ROI-provable use cases |
| Hybrid (composite) | Base + metered + optional outcome | 61% and rising | +38% vs. subscription | Most mid-market B2B SaaS |
Sources: Simon-Kucher Global Pricing Study 2025, SaaS Magazine Hybrid Pricing 2026, Bessemer AI Pricing Playbook.
Frame 1: Per-Seat (Per-User) Pricing
Per-seat remains the most intuitive model: customers pay a fixed recurring fee for each user granted access. It still dominates absolute market share — 57% of SaaS companies use per-user pricing as their primary model, down from 64% in 2024 (SaaS Pricing Benchmark Study 2025). Median per-user price across segments is $45/month, with vertical variance running from HR tech at $8/user to security at $89/user.
Per-seat's durability comes from procurement simplicity. Its structural failure is the decoupling of price from realized value. A light user and a power user pay the same. Team expansion is gated (customers restrict seat access to save money). And the model collapses entirely when AI agents do work without a human seat assignment — which is precisely the use case explosion of 2025–2026. For mid-market, per-seat remains viable but increasingly functions as the base layer of a hybrid model, not the whole architecture.
Frame 2: Tiered Feature-Based Pricing
Tiered pricing divides the product into discrete plans — typically Starter, Professional, Enterprise — each with a different price and feature bundle. The psychological engine is the Goldilocks effect: given three options, most customers avoid the cheapest (quality anxiety) and most expensive (unnecessary) and land on the middle tier, which you design as the revenue sweet-spot. Three-tier structures convert 20–35% better than single-tier offerings and deliver 30–50% higher ARPU than four-plus-tier structures (InfluenceFlow 2026; Price Intelligently analysis of 512 SaaS companies).
The trap is complexity. Five-plus tiers reduce conversion by up to 40% compared to three-tier structures. Feature differentiation must pass the "one-sentence test" — every tier explainable in a single sentence to a prospect. Gaps between tiers must span 50–100% minimum; a 10–20% gap ($29 vs $31) encourages downtrading; 150%+ gaps undermine mid-tier value perception. The Gainsight case is the canonical warning: bundling mid-market needs into a linear three-tier structure without segment-mapping caused revenue stagnation and customer confusion until pricing was re-architected to match actual personas.

For mid-market operators, tiered feature-based pricing is often the pragmatic middle ground — it captures the psychological benefits of choice and value clarity without the implementation burden of consumption metering. The discipline is ongoing: tiers decay as products evolve, so treat the tier structure as a living artifact that gets reviewed every six months, not an annual exercise. Pair it with willingness-to-pay research (Van Westendorp PSM or Gabor-Granger) to calibrate gap size, and track cohort conversion by tier so you can detect when the Goldilocks effect breaks down.
Frame 3: Usage-Based (Consumption) Pricing
Usage-based pricing ties cost directly to consumption — per API call, per token, per gigabyte, per workflow executed. Adoption has gone vertical. 85% of SaaS leaders have adopted usage-based elements, and the Metronome 2025 report documents that 77% of the largest software companies use consumption pricing specifically to unlock revenue expansion. Companies running usage-based or hybrid models report 18–23% higher NRR than pure subscription peers. High-growth SaaS (>40% YoY) using hybrid or consumption models show 21% median growth, outpacing pure subscription (ValueShips, Flexera 2026).
The operational advantage is alignment — customers pay proportionally to value received, which accelerates procurement approval because risk is visibly bounded. For AI-native products, usage-based pricing is effectively mandatory: token-based pricing is the emergent standard for LLM-embedded products. The two critical failure modes: (1) revenue unpredictability — customer invoices fluctuate monthly, complicating forecasting; and (2) invoice shock — customers abandon or churn when overage charges surprise them. Both are operationally solvable with consumption alerts, configurable caps, and transparent usage dashboards, but they must be engineered in from day one.
Frame 4: Value-Based and Outcome-Based Pricing
Value-based pricing anchors fees to the economic value the customer realizes. Outcome-based goes further: vendor and customer establish a measurable outcome (tickets resolved, documents processed, revenue generated) and price per unit of outcome. Gartner projected 40% of enterprise SaaS would incorporate outcome-based elements by 2025, up from 15% a few years prior (cited in BetterCloud 2026). The adoption is real but mostly in the form of outcome tiers layered on subscription bases, not full replacement.
Zendesk's AI resolution pricing at $1.50 per AI-resolved ticket drives 31% retention uplift and 21% customer satisfaction improvement. Intercom's Fin AI agent prices at 99¢ per customer resolution, charged only when the agent successfully resolves. These models work when outcomes are binary, measurable, and defensible. They fail when outcomes are subjective ("improved collaboration") or when customer instrumentation is opaque. For mid-market, outcome-based pricing is most viable as a supplementary option for high-ROI AI use cases, not a replacement of the subscription core.
The Hybrid Imperative
61% of SaaS companies now employ hybrid pricing, up from 49% in 2024. Hybrid typically layers a predictable subscription (base revenue, infrastructure coverage) with usage tiers (expansion capture) or outcome components (value alignment). Kyle Poyar of OpenView has noted that hybrid is "where most of the smart money is going" — it resolves the tension between predictable recurring revenue and capturing value as customers scale. For a mid-market operator running our $10M-to-$50M playbook, hybrid is the default recommendation.
Your pricing architecture is a system — and like every other system in your business, it should be engineered, instrumented, and governed, not improvised in sales calls. peppereffect's Conversion Engine deploys pricing governance, tier architecture, and discount ROI tracking as part of Pillar 2 (Sales Administration).
Book a Growth Mapping CallThe 4 Pillars Playbook breaks down the entire framework with deployment maps, KPIs, and real case studies across SaaS, recruiting, and coaching.
Open the Interactive PlaybookFive Pricing Mistakes That Kill Margins
Every failing pricing architecture we diagnose in mid-market B2B SaaS contains some combination of these five patterns. They are not edge cases; they are the modal errors.
Mistake 1 — Race-to-the-Bottom Discounting Without ROI Discipline
A 1% revenue discount does not yield a 1% margin reduction. For a 70–80% gross margin SaaS, a 20% revenue discount translates to a 25–30% reduction in gross profit on that deal (ProfitWell / Monetizely, 2026). ProfitWell's longitudinal data shows companies with undifferentiated discount strategies grow 23% slower than peers with targeted, win/loss-informed approaches.
The antidote is discount ROI tracking. Every discount should be evaluated against a testable hypothesis: "This customer will achieve X NRR and Y LTV uplift due to earlier adoption, making the discount ROI positive." Track discounted cohorts separately. Measure their NRR against undiscounted peers. Establish guardrails: discounts under 10% approved by sales leadership; 10–20% require CFO approval with ROI business case; 20%+ require CEO sign-off. Gong's own pricing data shows average enterprise discount of ~14% with top-tier reaching 20–25% for multi-year — that is the discipline benchmark, not the 30–40% the sales team will ask for.
Mistake 2 — Feature Proliferation and the Complexity Trap
As products mature, pricing decays into chaos: too many tiers, too many add-ons, incomprehensible value differentiation. Moving from four tiers to three pricing options increases conversion rates by an average of 27% (ConversionXL / Monetizely). HubSpot benchmark data shows conversion rates ~40% higher for three-tier versus five-plus-tier structures. Beyond six tiers, customers hit cognitive overload and abandon the pricing page rather than choose. Audit your current pricing page: can a prospect with 30 seconds understand the differentiation between every tier? If no, you are losing deals you should be winning.
Mistake 3 — Grandfathering Legacy Customers Indefinitely
The temptation when raising prices is to grandfather existing customers on old rates forever. This creates a permanent revenue drag. Price Intelligently research indicates companies that never sunset legacy tiers experience 3–8% NRR drag over three years. For a $10M ARR company, that is $300K–$800K in compounding lost revenue annually. The fix is deliberate grandfathering windows: honor legacy pricing for 12–18 months, then offer migration incentives (feature unlocks, bundled pricing, waived implementation fees for the new tier) and enforce the deadline with 60-day notice. Permanent grandfathering signals pricing weakness; time-boxed grandfathering signals professional change management.
Mistake 4 — Anchoring Pricing to Cost, Not Willingness-to-Pay
Engineering-founded SaaS companies over-index on cost-plus pricing: infrastructure + development + support + support, marked up. This ignores that willingness-to-pay varies by a factor of 2–4x across B2B SaaS customer segments for identical functionality (Price Intelligently / Monetizely, 2026). A $50K annual software spend is 2% of an enterprise CFO's budget but 50% of a 10-person SMB's software spend. Cost-based pricing guarantees suboptimal capture across heterogeneous segments. The fix is willingness-to-pay research: Van Westendorp PSM, Gabor-Granger, or conjoint analysis — covered in detail below.
Mistake 5 — Divorcing Pricing From Product Packaging and Customer Lifecycle
Pricing that exists independently of product architecture is suboptimized. Kyle Poyar's work on PLG companies emphasizes the value metric — a unit of measurement that scales proportionally with the value customers receive. Slack (per active user), Snowflake (per compute hour), Stripe (per dollar of payment volume). A well-chosen value metric drives product behavior: customers have clear incentive to expand usage because expansion is directly tied to price. Packaging must also evolve by customer stage: freemium tier → high-friction paywall at value realization moment → hybrid base+usage for mid-market → outcome-based for enterprise. A mature pricing architecture maps to the customer's expansion lifecycle, not just your product catalogue.
2025–2026 Market Shifts: Usage-Based, Outcome-Based, and AI Agent Pricing

The structural shift of the 2025–2026 cycle is not incremental — it is a re-foundation of how software gets priced. Three forces are converging: customer demand for usage-aligned pricing, AI workloads that seat-based pricing cannot capture, and unit economics pressure that rewards hybrid architectures. Forrester's provocatively titled 2026 analysis, "SaaS As We Know It Is Dead", names the dynamic: the industry-standard per-seat subscription is being replaced by hybrid consumption architectures within a 24–36 month window.
The Usage-Based and Hybrid Transition
OpenView's 2023 research reported 45% of SaaS businesses had implemented "some form" of usage-based pricing; by 2025 that climbed to 61–85% depending on survey. The BetterCloud 2026 analysis reports 80% of customers say usage-based pricing provides better alignment with value received. For AI-native products and any workflow where one customer deploys an agent to automate work previously done by 10 seats, seat-based pricing is structurally broken — you cannot charge "100% off seat pricing" and sustain the business. Hybrid — base subscription plus metered usage or outcome tier — is the convergent answer.
AI Agent Pricing: The Emerging Standard
The most significant 2025–2026 development is purpose-built pricing models for AI agents and autonomous systems. Salesforce Agentforce (May 2025) introduced three parallel models simultaneously:
- Conversational pricing: $2 per conversation (legacy model for simple agent interactions)
- Flex Credits: $0.10 per action, 20 credits per action, $500 per 100,000 credits (outcome-based)
- User licenses: Per-user-per-month for employee-facing agent usage
Anthropic's Claude Code pricing similarly offers three dimensions: API pay-as-you-go at $5–$25 per million tokens by model tier, Claude Max subscription tiers at $100/month (5× Pro capacity) or $200/month (20× Pro capacity), and token caching mechanisms. OpenAI's token-based GPT pricing established the reference model for LLM-native products. The strategic question for every mid-market SaaS CEO integrating AI: what metric best captures customer value from the agent — conversations, tasks completed, or business outcomes achieved? The answer determines whether your pricing is conversation-based, task-based, or outcome-based.
Sequencing the Transition Without Breaking Existing Customers
The transition to hybrid is near-mandatory within the next 12–24 months. But sequencing matters more than speed. The safest path is a "base-plus-usage" hybrid with cohort-based rollout:
Months 1–2: New Customers Adopt Hybrid
Default new customers to the hybrid model from signup. Base subscription covers infrastructure and support; usage tier captures expansion. Keep the base price familiar to reduce sticker shock.
Months 3–4: Measure Cohort Performance
New customers under hybrid should show 10–15% ARPU uplift vs. legacy cohort and hold or improve NRR. If churn spikes >2 percentage points, iterate before broader rollout.
Months 5–6: Migration Incentives for Legacy
Offer existing customers migration incentives — one-time discount, feature unlock, waived onboarding to the hybrid tier. Communicate the value case proactively: "pay more if you use more, save if you use less."
Months 7–12: Enforce Migration Deadline
Set a sunset date with 60-day notice. Mission-critical customers unwilling to migrate stay on legacy for an additional 12 months with explicit re-evaluation. Communication discipline is non-negotiable.
Willingness-to-Pay Research Methods (And When to Use Each)
Defensible pricing decisions require data. Three research methods dominate mid-market B2B SaaS pricing: Van Westendorp PSM, Gabor-Granger, and conjoint analysis. Each has distinct strengths, cost profiles, and implementation complexity.
| Method | What It Does | Sample Size | Cost / Time | Best Use |
| Van Westendorp PSM | 4 price perception questions; identifies acceptable range | 100–300 | Low / 2–4 weeks | Establish price corridor |
| Gabor-Granger | Sequential yes/no at multiple price points; builds demand curve | 100–500 | Low-Medium / 3–6 weeks | Refine specific price points |
| Conjoint Analysis | Bundle choice modeling; quantifies feature value | 300–500 | High / 6–10 weeks | Design tiered architecture |
Sources: Monetizely Van Westendorp PSM, Price Elasticity in B2B SaaS.
Van Westendorp Price Sensitivity Meter
Developed by Dutch economist Peter van Westendorp in 1976, the PSM asks four questions: (1) At what price would you consider the product too expensive? (2) At what price is it so expensive it's not worth buying? (3) At what price would you consider it a bargain? (4) At what price would you consider it too cheap, raising quality concerns? Plotting responses identifies the point of marginal cheapness, point of marginal expensiveness, optimal price point, and indifference price — together defining the "acceptable price range." PSM is best used as a starting point to establish the corridor, followed by Gabor-Granger or conjoint refinement.
The Gabor-Granger Method
Named for economists Andre Gabor and Clive Granger, this method presents respondents with sequential price points and asks a binary purchase question at each: "Would you buy at this price?" Rather than a single stated price, you build a demand curve that models how purchase intent changes with price. Survey-based Gabor-Granger shows 80% accuracy in predicting actual B2B SaaS price sensitivity when properly implemented (Monetizely, 2026). For mid-market operators, Gabor-Granger can be deployed lightweight: survey 50–100 target customers with 3–4 price points each, find the price where purchase intent drops below 40%.

Best-in-class B2B SaaS companies run pricing research and re-evaluation every 6–9 months, not annually (OpenView / Kyle Poyar frameworks, 2026). The logic is pragmatic: if a pricing change is successful, it compounds quarterly; if it fails, catching the issue within 6–9 months rather than 18 months minimizes damage. The full cycle is: Months 0–1 define hypothesis, Months 1–2 willingness-to-pay research, Months 2–3 design and A/B test options, Months 3–4 cohort performance analysis, Months 4–6 phase in or iterate, Months 6–9 prepare next iteration. For our Sarah Chen with margin pressure, a 6–9 month cadence allows two full pricing cycles per fiscal year — sufficient to capture compounding effects without operational disruption.
Implementation Framework: Re-Pricing Without Breaking the Engine
Technical pricing research is necessary but not sufficient. What determines success is governance — the decision rights, escalation procedures, and audit trails that prevent ad-hoc discounting and analysis paralysis. The Simon-Kucher framework rests on three foundational questions: What do we manage? Who manages it? How do we manage it?
Pricing Governance for Mid-Market
A lightweight governance structure for a $10M–$40M ARR operation:
- Pricing committee: CEO, CFO, Chief Revenue Officer — meeting quarterly to review hypothesis and re-evaluation results
- Discount approval policy: under 10% approved by sales leadership; 10–20% requires CFO approval; 20%+ requires CEO approval and documented ROI business case
- Annual price increase policy: all customers notified 30 days in advance; grandfathered customers migrated on defined timeline; new customer tiers updated quarterly
- Usage/outcome tier policy: new customers default to hybrid; legacy may maintain subscription with explicit migration incentive path
- Measurement cadence: cohort ARPU, churn, and NRR reviewed monthly; unit economics reviewed quarterly against pricing hypothesis
According to ChartMogul data, successful pricing optimisations yield ARPU increases of 15–25%. If your change does not deliver 10–15% ARPU uplift within 90 days, or if churn spikes more than 2 percentage points, iterate. Track metrics for six months post-implementation — short-term noise frequently obscures the true signal.
Frequently Asked Questions
How often should B2B SaaS companies re-price?
Best-in-class B2B SaaS companies re-evaluate pricing every 6–9 months and implement changes quarterly to semi-annually. The typical cadence is two full cycles per year: one aligned to annual budgeting (Q4 or Q1) and one opportunistic (mid-year, in response to competitive or product changes). Only 28% of companies increased prices in 2024 and many lagged inflation, suggesting under-pricing remains the modal error. If your pricing has not changed in 12+ months, re-evaluation should be immediate.
Should I grandfather legacy customers when raising prices?
Selectively, with time limits. Honor legacy pricing for 12–18 months, then offer migration incentives (feature unlocks, bundled pricing, waived implementation fees) and enforce the deadline. Price Intelligently research indicates permanent grandfathering creates 3–8% NRR drag over three years. For a $10M ARR company, that is $300K–$800K in compounding lost revenue annually. Give customers 60-day notice of migration deadline with a clear value pitch and genuine incentive — this prevents surprise churn and signals pricing professionalism.
Is value-based or outcome-based pricing realistic for SMB B2B SaaS?
Realistic if outcomes are binary, measurable, and defensible. Zendesk's $1.50-per-resolved-ticket and Intercom's 99¢-per-resolution work because resolution is auditable, ROI-correlated, and forecastable. Value-based pricing fails on subjective outcomes ("improved collaboration"). For mid-market SaaS without clear quantifiable outcomes, hybrid models (base plus usage or expansion tiers) capture 60–70% of value-based pricing's benefits without the measurement burden. Kyle Poyar's recommendation: start with hybrid — a value metric-driven usage tier — and graduate to outcome-based only after the value metric has proven predictive for 12+ months.
How do I price AI features without cannibalizing the base product?
Three strategic options exist: (1) Access-gated — AI features only in higher tiers, simple and protects margins but creates artificial segregation; (2) Usage-gated — baseline AI included in all plans, heavier usage requires upgrade or overage (Salesforce Agentforce Flex Credits model) — customers experience AI value immediately and pricing captures expansion; (3) Add-on — AI sold separately as $X/month on top of base — simple but customers hesitate to add marginal products. The Bessemer AI Pricing Playbook recommends testing new AI pricing with new prospects first because legacy customers are anchored to prior expectations. Usage-gated with outcome graduation is the winning pattern observed in Salesforce, Intercom, and Anthropic models.
Should I move to hybrid pricing if my customers love per-seat?
Yes, carefully and with communication. Hybrid is not a replacement for per-seat — it adds per-usage or outcome tiers on top of the per-seat base. New customers default to hybrid from day one (base seat fee plus usage overage or optional outcome tier). Existing customers maintain pure per-seat with the option to add hybrid components, ideally with a trial period at no cost to demonstrate value. Reframe hybrid as "flexible" and "aligned to usage," not as a feature addition or price increase. For mid-market, hybrid is the alignment mechanism — "pay more if you use more, save if you use less" — not the premium upsell.
What is the optimal number of pricing tiers?
Three tiers is the empirical optimum for B2B SaaS. Research from Price Intelligently, ConversionXL, and HubSpot shows three-tier structures convert 20–40% better than single-tier offerings and achieve 30–50% higher ARPU than four-plus-tier structures. The psychology is the Goldilocks effect. Gaps between tiers should be 50–100% minimum — a 10–20% gap encourages downtrading; 150%+ gaps feel excessive. A proven mid-market structure: Starter at $29–$49/user/month, Professional at $79–$129/user/month (50–80% premium), Enterprise at custom pricing (2–4× Professional).
How do I measure whether pricing changes are working?
Track five metrics: (1) Conversion rate — % of visitors converting to paid/trial; (2) ARPU by cohort — new customers should show 10–20% uplift if tiered pricing is successful; (3) CAC payback — under 12 months excellent, 20 months current median; (4) Churn — a well-executed change should not increase churn more than 1–2 percentage points; spikes >3pp require re-evaluation; (5) NRR — high-performing SaaS targets 110%+. Successful pricing optimizations yield ARPU increases of 15–25% per ChartMogul data. If your change does not deliver 10–15% uplift within 90 days, or churn spikes >2pp, the change likely needs iteration.
Systemic Leverage: Pricing Is an Operating System, Not an Annual Exercise
The evidence throughout this guide establishes pricing as the highest-ROI growth lever available to mid-market B2B SaaS operators. A 1% improvement in price realization yields 11% operating profit gains — more than 3× the leverage of equivalent volume gains. Yet the modal company re-prices less than annually and spends fewer than six hours per year on pricing strategy. The 2025–2026 shift toward hybrid, usage-based, and outcome-based models is not a fad but a fundamental realignment of SaaS unit economics. 61% of companies now employ hybrid pricing, with those companies reporting 38% higher NRR than pure subscription peers.
For the Sarah Chen archetype, the implementation pathway is clear: conduct willingness-to-pay research within 30 days using PSM or Gabor-Granger; design a three-tier structure with 50–100% gaps aligned to customer segmentation; establish formal pricing governance (CFO-led committee, discount approval policy, quarterly re-evaluation); implement hybrid pricing for new customers with migration incentives for legacy; measure via ARPU uplift (target 10–15% within 90 days), churn stability, and NRR improvement (target 110%+ within six months). The path is architectural, not opportunistic — which is why it works.
Deploy Your Pricing Engine as Part of Your Freedom Machine
peppereffect is the Master Growth Architect for mid-market B2B SaaS. We install the pricing governance, tier architecture, willingness-to-pay research cadence, and discount ROI instrumentation that decouple revenue from headcount. The 4 Pillars methodology treats pricing as a systemic margin lever, not a finance afterthought — deployed inside Pillar 2 (Sales Administration) alongside CRM automation, proposal generation, and lead nurture.
Book Your Growth Mapping CallRead: Decouple Revenue from Headcount — The 5-Step Blueprint →
Resources
- Simon-Kucher Global Pricing Study 2025 — Full Brochure
- Why Cutting Costs Isn't Cutting It — McKinsey & Deloitte Pricing Data (PriceAgent, 2026)
- RockingWeb / BenchmarkIt SaaS Metrics Benchmark Report 2025
- SaaS Capital Benchmarking Metrics for Bootstrapped SaaS 2025
- Bessemer Venture Partners — The AI Pricing and Monetization Playbook
- Monetizely — The 2026 Guide to SaaS AI and Agentic Pricing Models
- Salesforce Agentforce Flexible Pricing Announcement (May 2025)
- Forrester — SaaS As We Know It Is Dead: How to Survive the SaaS-pocalypse


