

What is revenue per employee (RPE), and why does it matter?
Revenue per employee (RPE) is the single clearest proxy for operational leverage in a B2B SaaS company. It measures how much annual recurring revenue your business generates for each full-time equivalent (FTE) on the payroll — and for mid-market founders scaling from $10M to $40M ARR, it is the ratio that either unlocks a premium valuation or compresses it. AI automation ROI framework
The formula is simple: Total ARR ÷ Total FTEs = RPE. The strategic consequences are not. In 2025, the median private SaaS company reported $129,724 per employee, according to SaaS Capital's 14th annual benchmark survey of 1,000+ companies. Public SaaS companies hit a median of $283k, with the top quartile reaching $369k. Elite AI-native operators — Cursor, Midjourney, ElevenLabs — are now reporting numbers that make even Big Tech look inefficient.
What you'll learn in this article:
- The precise formula for revenue per employee (and the FTE counting rules that matter)
- 2025 RPE benchmarks across SaaS, professional services, finance, and Big Tech
- Why investors now use RPE as a gate for premium valuation multiples
- The six drivers that separate $600k+ RPE operators from the $200k median
- The agentic automation framework that moves mid-market SaaS from median to top-quartile in 12-18 months
- How to install an RPE measurement cadence that catches stalls before they become structural
Core Thesis
Revenue per employee is not an HR metric — it is a capital-efficiency signal. The companies that will win the agentic era are the ones that decouple revenue from headcount by installing autonomous systems across Sales Development, Customer Success, Revenue Operations, and Support. Every $50k of RPE gain is worth $8M-$18M in enterprise value at mid-market SaaS multiples.
How do you calculate revenue per employee correctly?
The formula looks trivial, but three accounting choices decide whether your RPE is truthful or flattering:
1. Use ARR, not total revenue SaaS unit economics framework. For SaaS, one-time implementation fees and professional services revenue distort the picture. A $20M ARR company with $2M in services revenue should not report $22M ÷ 70 FTE = $314k. Report $20M ÷ 70 = $286k — that is the sustainable, recurring number an investor will use.
2. Count FTEs honestly. Full-time staff count as 1.0 FTE. Part-time staff (20 hrs/week) count as 0.5. Ongoing contractors bill as 0.75-1.0 monthly recurring revenue levers depending on engagement. Offshore engineers in India, Poland, or the Philippines count as 1.0 — no geographic discount. Only temporary contractors under three months are excluded.
3. Decide on the denominator variant. Beyond headline RPE, three variants matter:
| Variant | Formula | What It Reveals |
| Revenue per FTE | ARR ÷ FTE-adjusted headcount | Headline productivity metric |
| Gross Profit per Employee | (ARR − COGS) ÷ FTEs | Margin-adjusted productivity |
| Revenue per Sales FTE | ARR ÷ sales headcount | Sales organisation efficiency |
| Engineering Productivity Ratio | ARR ÷ engineering FTE | Product delivery leverage |
Sources: Benchmarkit 2025 SaaS Performance Metrics, SaaS Capital 2025
The most honest signal for a mid-market SaaS board is Revenue per FTE using ARR as the numerator. This is the number that matters when a growth architect diagnoses whether your organisation has operational leverage or organisational bloat.

The 4 Pillars Playbook breaks down the entire framework with deployment maps, KPIs, and real case studies across SaaS, recruiting, and coaching.
Open the Interactive PlaybookWhat are the revenue per employee benchmarks by industry in 2025?
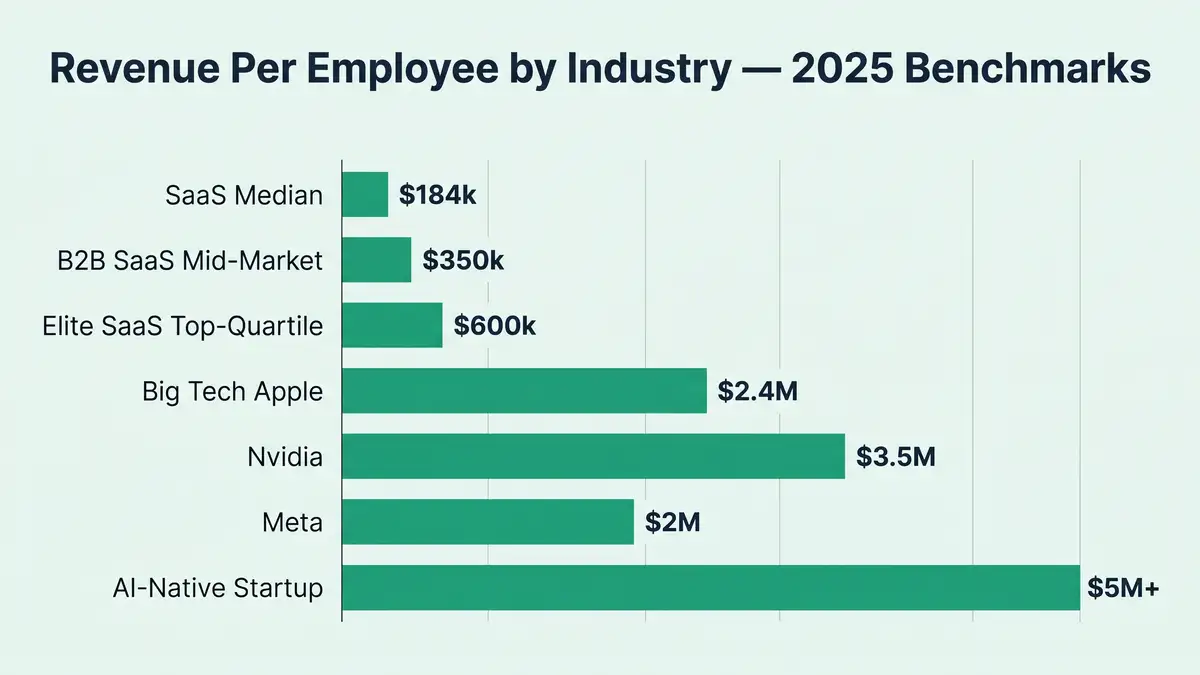
RPE varies dramatically by business model. Software margins, platform economics, and automation maturity are what separate a $3M Nvidia-class operator from a $100k manufacturing floor. The numbers below anchor a realistic target for a $10M-$40M ARR mid-market SaaS.
According to HR Bench's 2025 cross-industry analysis, the average revenue per employee across all industries sits around $350k — a number inflated by capital-light digital giants and depressed by labour-heavy retail. Software and SaaS occupy a wide distribution, with the best performers operating two to ten times above the median.
SaaS and Software Benchmarks
| Segment | Median RPE | Top Quartile | Elite / AI-Native |
| Private SaaS (all stages) | $129k | $240k | $400k+ |
| Public SaaS | $283k | $369k | $600k+ |
| Mid-market SaaS ($10M-$40M ARR) | $200k-$300k | $350k-$500k | $600k-$750k |
| Vertical SaaS (healthcare, legal, construction) | $280k-$380k | $400k-$550k | $600k-$1M |
| PLG-first SaaS (Figma, Notion archetype) | $300k-$500k | $550k-$900k | $1M-$5M |
| AI-native SaaS (post-2022 founding) | $500k-$1M | $2M-$5M | $8M-$15M |
Sources: SaaS Capital 2025 RPE Benchmarks, Bessemer State of AI 2025, Benchmarkit / Emergence 2025
Big Tech Reference Points
The mega-cap tech companies set the ceiling. These numbers are pulled directly from 2024 10-K filings:
| Company | Revenue | Employees | RPE |
| Nvidia | $60.9B | ~29,600 | ~$3.0M |
| Netflix | $31.6B | ~12,800 | ~$2.7M |
| Apple | $394B | ~164,000 | ~$2.4M |
| Meta | $114B | ~67,400 | ~$2.0M |
| Alphabet (Google) | $307B | ~186,000 | ~$1.9M |
| Adobe | ~$20B | ~24,000 | ~$833k |
| Shopify | ~$6.7B | ~10,500 | ~$638k |
| Zoom | ~$4.4B | ~8,500 | ~$518k |
| Salesforce | ~$40B | ~80,000 | ~$500k |
| Datadog | ~$1.7B | ~4,200 | ~$405k |
Source: 2024 SEC 10-K filings; aggregated via Bessemer State of AI 2025 analysis
The pattern is clear: platform economics + software margins + minimal manual operations = ceiling-level RPE. Nvidia's $3M per FTE is achievable because its product has near-zero marginal cost and its go-to-market requires almost no human coordination. Your $20M ARR SaaS will not hit $3M RPE — but $500k is structurally reachable, and the gap from $250k to $500k is worth more to an investor than a full round of new-logo hiring.
Every figure on this page in one spreadsheet: SaaS, vertical, PLG, AI-native, and Big Tech RPE medians and top-quartile marks, with sources and the FTE-counting rules. Drop your own numbers in alongside.
Download the 2026 RPE dataset (CSV) ↓The Mid-Market Target
If your company is in the Sarah Chen band AI for SaaS playbook — $10M-$40M ARR with 50-200 employees — your realistic top-quartile RPE is $400k-$600k. Anything below $250k with growth under 25% YoY is a structural warning sign. Anything above $600k with stable NRR is a premium-valuation company.
You benchmark your revenue metrics. Benchmark your AI visibility too. Our free 3-minute AI Visibility Check measures how often the four AI engines cite you when buyers ask.
Run my free AI Visibility Check →Why does revenue per employee matter to investors and your valuation?

Investors no longer accept the 2021-era narrative that "growth at all costs" justifies any headcount trajectory. In the capital-efficient era that began in 2023 and hardened through 2025, RPE has become the operational metric that gatekeeps valuation multiples. Bessemer Venture Partners' analysis of 2024 SaaS exits found that companies with median RPE above $350k in their final pre-exit year traded at 8.5x mean revenue multiple, versus 5.2x for companies in the $180k-$250k band.
The mechanics are mechanical. A $20M ARR SaaS with $400k RPE (50 employees) trades at 8.5x-12x = $170M-$240M enterprise value. The same $20M ARR with $250k RPE (80 employees) trades at 5.5x-7.5x = $110M-$150M. The RPE gap of $150k per employee translates directly into a $60M-$90M valuation delta.
This is why AI automation for B2B growth has become a boardroom conversation agentic workflows for B2B operations, not an engineering one. RPE is the scoreboard that translates every automation decision into dollars of enterprise value.
The Rule of 40 Interaction
RPE does not replace the Rule of 40 (growth rate + EBITDA margin ≥ 40%) — it reinforces it. SaaS Capital's 2025 research shows that companies with RPE above $350k can pass Rule of 40 with 30% growth + 10% EBITDA margin. Companies at $200k RPE need 35%+ growth alone to compensate, which places enormous strain on the sales function and accelerates the need for even more hires — creating a doom loop of declining efficiency.
The resolution is operational leverage, not a more aggressive growth plan. This is the territory where a properly architected agentic AI system stops being a feature and becomes the single highest-ROI capital allocation a mid-market CEO can make.
What drives high revenue per employee? The six multipliers.
Elite RPE is not an accident of market timing. It is the product of six compounding operational decisions. Companies that achieve $500k+ RPE in mid-market SaaS typically execute on at least four of these six drivers.
Product-Led Growth (PLG) go-to-market
PLG companies achieve 2-3x higher RPE than sales-led peers at the same ARR scale. Figma, Notion, and Slack all hit $900k-$1.5M RPE pre-acquisition by replacing sales-heavy onboarding with self-serve product experiences. PLG eliminates the 8-15 FTEs a traditional sales-led company needs per $10M of new ARR.
Vertical pricing power and ACV expansion
Vertical SaaS (healthcare, legal, construction, logistics) commands 2-3x pricing premium versus horizontal SaaS. A $50k ACV construction-tech deal with the same sales-team efficiency as a $15k ACV horizontal deal produces 3.3x the RPE. Vertical median RPE sits at $320k-$450k; horizontal median at $200k-$300k.
AI-native and agentic architecture
Companies founded after 2022 on LLM foundations achieve $1M-$15M RPE by eliminating three traditional cost centres: customer success (the product self-onboards), sales (virality and earned media replace paid acquisition), and tier-1 support (LLM triage handles 70-80% of tickets). Cursor reportedly runs at ~$5M RPE; Midjourney at $8M-$15M.
Automation of high-touch functions
Manual process elimination across Sales Development, Customer Success, Sales Operations, and Support accounts for 35-45% of the total RPE uplift opportunity in mid-market SaaS. Deploying B2B sales automation and CRM automation typically returns $30k-$60k of RPE per FTE eliminated or reallocated.
Low middle-management overhead
Stripe operates at approximately 1 manager per 12-15 individual contributors; the industry norm is 1:6-8. Each additional layer of management adds 15-25% administrative overhead. Flat structures reduce coordination tax by 20-35% and free working capital for revenue-generating roles — the key reason infrastructure companies like Stripe maintain $1.5M-$2.5M RPE at scale.
High net revenue retention (NRR)
NRR above 120% allows ARR growth without proportional new-logo sales hiring. Datadog (NRR 127%), Cloudflare (119%), and Salesforce (127%) all translate this into RPE above $340k. When expansion revenue from existing customers drives growth, RPE rises 5-10% annually without headcount additions — the single cleanest compounding effect in SaaS economics. See our deep dive on net revenue retention benchmarks for the NRR playbook.

Why does revenue per employee stall? The five failure modes.
Most mid-market SaaS companies operating at $200k-$280k RPE are not there by accident. They are there because one or more of the following organisational bloat patterns has compounded over two to four years of growth. Recognise these early and you can intervene before the valuation cost becomes structural.

Hiring ahead of revenue is the most common killer. A company projects "$25M ARR in 24 months" and hires 50 people today — then lands at $18M, stuck at $180k RPE. Mid-market SaaS typically overhires by 15-25% because venture playbooks assume 30% growth while actual averages now sit at 20-22%, according to Lighter Capital's 2025 B2B benchmarks.
Bloated sales and account management is the second trap. When sales headcount grows faster than revenue — from 25 FTE producing $800k per rep to 35 FTE producing $714k per rep — the diagnostic is never "hire more salespeople." The root cause is low conversion rate, high churn, or poor pipeline quality, and throwing more reps at it accelerates RPE decline.
Broken expansion motion forces new-logo dependency. If NRR drops below 100% and gross churn exceeds 7% annually, the company must hire proportionally more sales hunters just to stand still — which pushes RPE down even as revenue holds flat.
Engineering bloat without revenue correlation is the silent killer. When engineering headcount grows 40% YoY but feature adoption grows only 10% and release velocity is flat, engineers are underutilised. Healthy engineering RPE sits at $800k-$1.5M per engineer. Below $600k, engineering is absorbing capital without producing leverage.
Silo fragmentation and coordination tax is the final pattern. When Sales, CS, Product, and Engineering operate independently, each customer interaction consumes 13+ people's attention instead of 8 — identical revenue, higher headcount, lower RPE. The fix is horizontal integration via cross-functional squads and workflow orchestration (n8n, Make, Temporal).
Avoid This Mistake
Do not respond to low RPE with a layoff. Cutting 20% of headcount in a panic destroys institutional knowledge, compounds churn (departed employees were often relationship holders), and signals distress to customers and investors. The right response is to deploy autonomous systems that absorb the manual workload, then redeploy human capital into high-leverage roles. That is how elite RPE is built — through surgical leverage, not blunt subtraction.
How do you improve revenue per employee? The agentic automation framework.
The fastest path from median to top-quartile RPE in a mid-market SaaS is a phased agentic automation programme. The McKinsey State of AI 2025 survey shows that organisations deploying multi-agent systems (as opposed to single-task AI tools) are reporting 20-35% productivity gains in knowledge work, with sales, customer support, and operations showing the largest uplift bands (25-50%). Gartner forecasts that 30% of enterprise knowledge workers will be augmented by autonomous agents by the end of 2026, rising to 60% by 2028.
The framework below is sequenced to maximise payback within 12-18 months.
| Function | Manual Baseline | Agentic Alternative | RPE Uplift per FTE |
| Sales Development (SDR) | 1 SDR = 100 emails/week; 5-8 meetings | 1 senior SDR + agent = 2,000 emails/week; 15-20 meetings | +$30k-$50k |
| Customer Success | 1 CS rep per 20 customers | 1 CS rep + automation = 1 per 50-60 customers | +$25k-$40k |
| Sales Operations | 2 ops FTE doing manual CRM hygiene | 1 ops FTE + n8n/Make orchestration agents | +$35k-$60k |
| Tier-1 Support | 5 support FTE handling triage + resolution | 3 support FTE + LLM triage + knowledge-base agent | +$20k-$35k |
| Demand Generation | Manual campaign setup and lead scoring | AI lead scoring + autonomous nurture sequences | +$15k-$30k |
Sources: McKinsey State of AI 2025, Benchmarkit 2025 SaaS Performance Metrics
A worked example: $20M ARR, 75 FTE, $267k baseline RPE
Consider a representative Sarah Chen profile — $20M ARR, 75 FTE, $267k RPE. An 18-month agentic deployment across four functions produces the following:
- SDR automation: reallocate 3 junior SDRs; pipeline rises from $20M to $28M. Net: +$1.6M ARR, −3 FTE.
- CS automation: 6 CS reps + 2 automation engineers manage 260 customers (up from 160) at 80% NRR (up from 70%). Net: +$2M expansion ARR, 0 net FTE change.
- Sales ops automation: 1 ops FTE + 1 automation engineer orchestrate clean data and real-time reporting; sales productivity rises 12%. Net: +$2.4M ARR, 0 net FTE change.
- Support automation: 2 support FTE + 1 automation engineer; CSAT rises 15%, churn drops 1-2 percentage points. Net: +$1.5M in retained ARR lifetime value, −2 FTE.
18-month result: ARR moves from $20M to $24.5M (+22.5%). Headcount moves from 75 to 70 FTE (−6.7%). RPE moves from $267k to $350k (+31%). Even after adding 5 automation engineers to manage the systems, adjusted RPE lands at $327k (+22%). Total programme investment is approximately $1.1M-$1.4M in year one; payback at standard gross margin is roughly 3-4 months.
Stop benchmarking. Start architecting. peppereffect installs the agentic operating system that moves your RPE from median to top-quartile — without a layoff and without sacrificing growth.
Book a Growth Mapping CallHow often should you measure and monitor revenue per employee?
RPE is a lagging indicator of structural decisions, so measurement cadence matters. The recommended rhythm for a mid-market SaaS is quarterly formal review + monthly leading-indicator monitoring + annual deep dive.
The quarterly review tracks total RPE, year-over-year change, and function-level RPE (Sales, CS, Engineering, Ops calculated separately). The monthly monitoring watches ARR growth rate versus FTE growth rate — if FTE is growing faster than ARR for two consecutive months, the company is in early-stage RPE decline and intervention is cheap. The annual deep dive connects RPE to Rule of 40, NRR, and CAC payback, and feeds headcount planning for the next fiscal year.
The warning threshold is a 15% QoQ decline in RPE. At that magnitude, the cause is almost always overhiring, a churn spike, or a revenue miss — and all three require different corrective action. Running autonomous CRM reporting that produces RPE dashboards weekly eliminates the lag that lets this problem compound.
Frequently asked questions
What is a good revenue per employee for mid-market B2B SaaS?
For companies in the $10M-$40M ARR range, the benchmark bands are: median at $200k-$300k, top-quartile at $350k-$500k, exceptional at $500k-$750k, and elite (AI-native or vertical premium) at $1M+. Context matters — growing at 30%+ YoY with $250k RPE is acceptable; growing at 10% with $250k RPE signals an efficiency problem that compounds quarterly. The goal for most Sarah Chen profiles is to move from the $267k median to the $400k+ top-quartile band within 12-18 months, which is almost always achievable through agentic automation rather than hiring freezes.
Should I use ARR or total revenue to calculate revenue per employee?
For B2B SaaS with recurring revenue models, always use Annual Recurring Revenue (ARR), not total revenue. Including one-time implementation fees, professional services revenue, or discretionary consulting inflates the number but misleads the board. An investor due-diligence team will recalculate using ARR only, and the discrepancy between your flattering headline number and their sober recalculation will damage the conversation. The exception is if your business model is fundamentally services-plus-software; in that case, report both total revenue per employee and ARR-only RPE transparently.
How do I handle part-time employees, contractors, and offshore staff in the RPE calculation?
Full-time employees count as 1.0 FTE. Part-time staff working 20 hours weekly count as 0.5 FTE. Ongoing contractors count as 0.75-1.0 FTE depending on engagement intensity. Offshore engineers in India, Poland, Philippines, or anywhere else count as a full 1.0 FTE — there is no geographic or compensation discount. Only temporary contractors engaged for less than three months are excluded entirely. These rules are consistent with the SaaS Capital Benchmarkit methodology, which is the default reference that investors and board members will use when comparing your numbers to cohort benchmarks.
Which public SaaS companies have the highest revenue per employee?
The top-quintile public SaaS RPE (calculated from 2024 10-K filings) places Nvidia at approximately $3.0M, Netflix at $2.7M, Apple at $2.4M, Meta at $2.0M, Adobe at $833k, and Shopify at $638k. Among mid-cap SaaS, Zoom sits at ~$518k, Datadog at ~$405k, Cloudflare at ~$344k, and HubSpot at ~$288k. The mid-cap cluster at $300k-$500k is the realistic reference for a mid-market private SaaS on a premium trajectory — anything above that range requires either PLG-dominance, AI-native architecture, or extreme vertical pricing power.
How do I improve revenue per employee without cutting headcount?
There are four plays that compound: (1) accelerate revenue via pricing increases, new product lines, or vertical expansion to add 10-20% ARR; (2) deploy agentic automation across SDR, CS, Sales Ops, and Support to capture 10-15% productivity per FTE; (3) reallocate headcount — reduce low-leverage manual roles via automation, hire in high-leverage engineering and product roles; (4) improve NRR by investing in product quality and customer success, retaining existing revenue without new hiring. The fastest compounding lever is automation: a 12% productivity gain applied to a $20M ARR base moves RPE by 15-20% within two quarters.
Is very high revenue per employee always a good sign?
No — context decides. RPE above $500k paired with growth under 10%, NRR under 100%, or employee turnover above 20% annually is a warning sign: the company is extracting productivity at an unsustainable human cost, or it has plateaued and is running out of growth options. Healthy elite RPE requires three conditions simultaneously: employees are productive but not burned out; growth rate stays at 20-30% or higher; and NRR remains above 105%. Check your EBITDA margin as well — if margins are negative despite high RPE, the business is losing money faster than it is generating productivity.
How does revenue per employee relate to the Rule of 40 and SaaS valuation multiples?
RPE and Rule of 40 are complementary. Companies with RPE above $350k can pass the Rule of 40 threshold with 30% growth + 10% EBITDA margin, because their cost structure allows faster margin expansion. Companies at $200k RPE need 35%+ growth alone to compensate for weaker margin leverage. On valuation, the RPE cohorts translate directly into ARR multiples: $150k-$250k RPE trades at 5.5x-7.5x; $250k-$400k at 7.0x-9.5x; $400k-$600k at 8.5x-12.0x; $600k+ at 10x-15x+. Moving from the median band to top-quartile is typically worth $50M-$100M of enterprise value at $20M-$30M ARR scale.
Ready to engineer top-quartile revenue per employee?
peppereffect is the Master Growth Architect for mid-market B2B SaaS operators who refuse to scale headcount linearly with revenue. We install the agentic operating system — autonomous SDRs, self-serve customer success, CRM automation, and workflow orchestration — that moves RPE from $267k median to $400k+ top-quartile within 12-18 months. No layoffs. No platform lock-in. Measurable freedom.
Book Your Growth Mapping CallKeep architecting: related systems and tools
Free tools: benchmark the retention and expansion levers behind RPE with the net revenue retention calculator, the ARPU calculator, and the full 2026 B2B SaaS benchmark dataset.
Install the systems: top-quartile RPE comes from deploying AI lead generation systems, sales administration automation, and AI operations systems across the customer lifecycle. See the full AI for SaaS playbook.
Resources
- SaaS Capital — 2025 Revenue Per Employee Benchmarks for Private SaaS Companies
- Benchmarkit — 2025 SaaS Performance Metrics Report
- Bessemer Venture Partners — State of AI 2025
- McKinsey — The State of AI: Global Survey 2025
- HR Bench — Revenue per Employee: 2025 Benchmarks by Industry
- SaaSletter — Benchmarkit / Emergence 2025 SaaS Benchmarks
- Lighter Capital — 2025 B2B SaaS Startup Benchmarks
- SaaS Capital — 2025 Benchmarking Metrics for Bootstrapped SaaS
4 Pillars of B2B Growth automate fulfillment without scaling headcount SaaS CEO's dilemma


