

What Does It Mean to Decouple Revenue from Headcount?
Every B2B founder hits the same wall. Revenue grows 30%, so you hire 30% more people. Margins compress, management overhead cascades, and the business becomes a treadmill where growth and complexity scale in lockstep. The median employee earning $80,000 per year actually costs organizations between $100,000 and $112,000 when factoring in employer taxes, benefits, equipment, and overhead — a multiplier of 1.25x to 1.4x salary. Scale that across 50 hires and you are looking at $1.5 million in hidden costs before a single new deal closes. Rule of 40 capital efficiency metric
Decoupling revenue from headcount means architecting your business so that revenue grows faster than your team. The companies that have cracked this do not treat it as a cost-cutting exercise. They treat it as an architectural decision — building systems, agentic workflows, and autonomous infrastructure that allows a 50-person team to operate with the throughput of a 150-person organization. The data proves this is not theoretical. SaaS Capital reports that the median revenue per employee for private SaaS companies reached $129,724 in 2025, yet companies like Basecamp generate $1.64 million per employee and Valve Corporation maintains $16.2 billion in revenue with only 350 employees — $46.3 million per employee.
What you will learn in this article:
- Why the traditional headcount-to-revenue equation destroys margins and creates fragile organizations
- Revenue per employee benchmarks across SaaS, professional services, recruiting, and coaching — and what top performers do differently
- How AI automation structurally changes the math, with specific data on sales, HR, and customer service automation capacity
- The franchise prototype principle and why systems-dependent businesses consistently outperform people-dependent ones
- A five-step blueprint for engineering super-linear growth in your B2B operatio LTV to CAC ration
Key Takeaway
The companies achieving the highest revenue-per-employee ratios — Valve at $46M, Netflix at $4.15M, Basecamp at $1.64M — do not hire the best people and hope for the best. They architect systems that allow ordinary people following well-designed processes to produce extraordinary results. This is the franchise prototype principle applied to modern B2B, and it is the single greatest lever for decoupling revenue from headcount.
Why Linear Scaling Destroys B2B Profitability
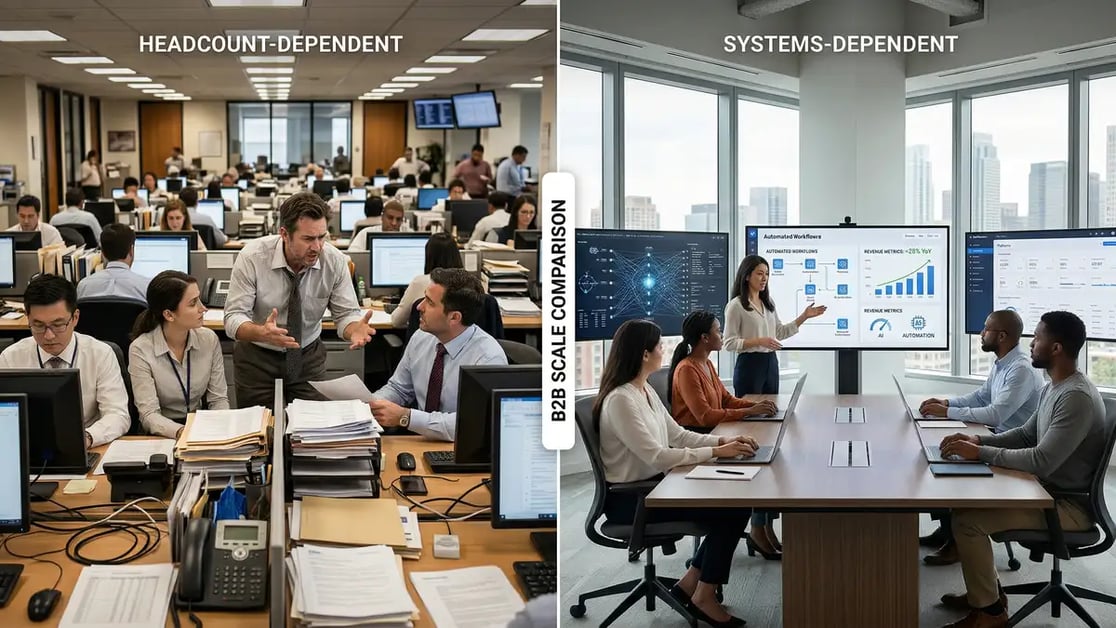
The conventional wisdom that revenue growth requires proportional hiring has governed B2B strategy for decades. A 30% increase in pipeline triggers a 30% increase in sales headcount. A new market expansion requires a new regional team. This linear model treats the relationship between revenue and people as inevitable rather than architectural — and it masks the true cost of scaling with bodies instead of systems.

Each additional hire triggers cascading overhead beyond salary. Adding a tenth person to a team creates nine new communication pathways. Management capacity requirements expand. Training infrastructure scales. And the risk of a poor hiring decision amplifies every cost. ASLI research indicates that a bad sales hire costs up to $240,000 when accounting for recruiting expenses, salary, training, 9 to 15 months of ramp time, lost deals, and opportunity costs — with 40% of service sales hires failing. Gallup documents that U.S. businesses lose approximately $1 trillion annually to voluntary turnover alone.
For a 100-person organization paying an average salary of $50,000, total turnover and replacement costs reach $660,000 to $2.6 million per year — representing 13% to 52% of total payroll expense. Yet despite these documented costs, most B2B companies continue treating headcount growth as the default response to revenue opportunities. This approach creates a profitability ceiling that becomes mathematically inescapable as expenses grow faster than revenue-generating capacity per employee. The people-dependent model is not just expensive — it is structurally fragile.
| Cost Category | Per Employee Impact | At 50 Employees |
| True cost multiplier (1.25-1.4x salary) | $100K-$112K on $80K salary | $5M-$5.6M total burden |
| Bad hire cost (sales roles) | Up to $240,000 | $2.4M per 10 bad hires |
| Annual turnover cost | $6,600-$26,000 | $330K-$1.3M annually |
| Management overhead per layer | 10-15% of managerial costs | $500K+ reducible |
Sources: Culta.ai, ASLI Research, Gallup, McKinsey
Want to see your own CAC against peer benchmarks? Run the CAC Diagnostic for your true CAC, the 30 to 50% reduction agentic deployment delivers, and a board-ready PDF in 60 seconds.
Run the CAC DiagnosticRevenue Per Employee: The Benchmarks That Reveal What Is Possible
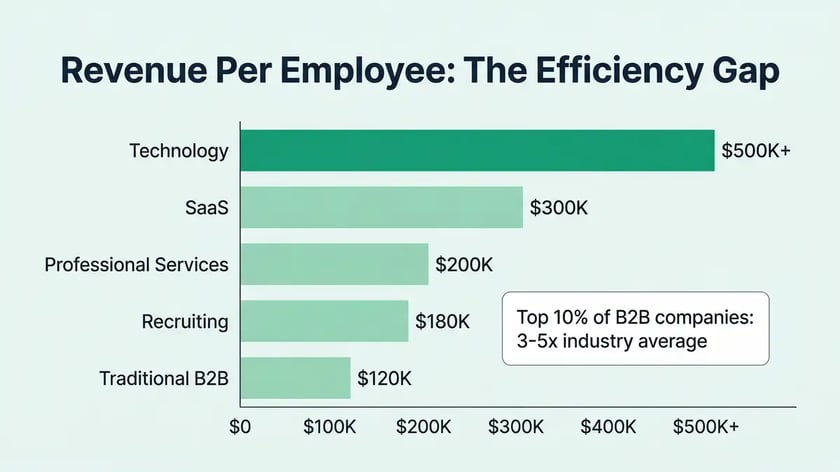
Understanding how the best companies dramatically outperform on revenue per employee provides the first clue to unlocking decoupling. The variance in this metric across comparable companies reveals that operational architecture, not market conditions, drives the outcome. Within SaaS alone, the range is striking: companies with $1M to $3M ARR demonstrate a median of $99,858 per employee, while bootstrapped companies in that same range generate $110,000 per employee — a 15% advantage over equity-backed peers that suggests capital availability paradoxically leads to hiring bias while revenue constraints force architectural discipline.
The comparison across industries tells an even more revealing story. Professional services firms globally averaged revenue per employee of $158,000 in 2024. SaaStr now argues that $500K ARR per employee is the new benchmark for "great," up from $200K just a few years ago. The AI-native companies are rewriting these benchmarks entirely: Cursor achieved $1B ARR with roughly 300 employees — $3.3 million per employee — while Midjourney runs $500M ARR with 100-160 employees.
| Company / Segment | Revenue Per Employee | Architecture Model |
| Valve Corporation (Steam) | $46.3M | Platform / marketplace |
| Netflix | $4.15M | Content + technology platform |
| Cursor (AI-native) | $3.3M | AI-native product |
| Basecamp | $1.64M | Self-serve SaaS, lean ops |
| Median SaaS (private) | $129,724 | Traditional SaaS |
| Professional services (global avg) | $158,000 | People-dependent services |
Sources: Guru3D/Valve, OnDeck Rankings, SaaStr, SaaS Capital
These outliers are not anomalies — they are exemplars of what becomes possible when architectural priorities shift from hiring more people to building more effective systems. McDonald's, the canonical example of systematized business design, generates $172,800 revenue per employee. As Michael Gerber articulated in the E-Myth framework, the fundamental question is not whether humans or systems are superior, but whether a business can be operated by ordinary people following well-designed systems to produce extraordinary results. The companies at the top of these benchmarks have answered that question definitively.
Key Takeaway
The 10x gap between median SaaS revenue per employee ($129K) and top performers like Basecamp ($1.64M) is not explained by better talent. It is explained by better architecture. Bootstrapped companies outperform equity-backed peers by 15% on this metric because capital constraints force systems thinking. Your constraint should be architectural discipline, not headcount budget.
How AI Automation Structurally Changes the Revenue-to-Headcount Equation
McKinsey's Global Institute analysis indicates that currently demonstrated technologies could automate approximately 57% of current U.S. work hours. This is not a future projection — this applies to technologies that exist right now. AI agents alone could perform tasks occupying 44% of U.S. work hours, while robots could handle 13%. For B2B companies that have historically assumed cognitive work requires human headcount, this represents a structural inflection point.
The economic case is already proven. A 2024 Microsoft/IDC study found that for every dollar NDR-driven growth invested in generative AI, companies achieve $3.70 in returns on average — with top-performing "AI leaders" achieving over $10 per dollar. BCG research corroborates this: the 5% of companies termed "future-built" achieve five times the revenue increases and three times the cost reductions from AI compared to everyone else. These companies dedicate up to 64% of their IT budget to AI.
Where does this capacity show up? Sales operations is the highest-impact domain. Salesforce's 2025 State of Sales documents that sales reps spend only 28-30% of their time actually selling — 70% goes to administrative tasks, data entry, and follow-ups. Cirrus Insight research shows AI-driven sales automation saves reps 2-3 hours daily. McKinsey confirms one-third of all sales tasks can be readily automated, with early adopters reporting 10-15% efficiency improvements and up to 10% sales uplift. HR automation is equally transformative — Infeedo data documents up to 70% reduction in manual HR tasks, while McKinsey estimates two-thirds of current HR tasks can be automated to a significant degree.
The Automation Trap to Avoid
Companies that increased sales and marketing spend without an efficient go-to-market operation in place saw negative Rule of 40 performance — the only cohort with a negative aggregate score in BCG's 2025 research. Capital investment in hiring and marketing, absent architectural efficiency, destroys value rather than creating it. Automate the system first, then scale the investment.
The Franchise Prototype: Why Systems-Dependent Businesses Always Win
Michael Gerber's E-Myth framework provides the conceptual foundation for understanding why some businesses scale without proportional headcount while others cannot. The core insight is deceptively simple but transformative in practice: a business's scaling capacity is determined not by the quality of its people but by the quality of its systems. When a business requires specific individuals to deliver consistent results, that business has a ceiling. When it achieves consistent results through documented processes that ordinary people can execute, scaling becomes a question of capacity replication — not talent scarcity.

Gerber describes what he terms the "Technician's Trap" — the condition where business owners remain trapped in the doing of the work rather than building a business that operates independently of their involvement. The franchise prototype principle represents the antidote: if you cannot write down exactly how something gets done, hand that document to someone new, and have them produce the same result, you do not have a system — you have a dependency. McDonald's exemplifies this at scale. Ray Kroc did not succeed because he hired the most skilled restaurateurs but because he codified operations into repeatable systems — training deepened, operational standards tightened, and replication became the chain's core strength.
This principle applies directly to modern B2B. SaaS companies can architect customer onboarding systems to operate consistently without requiring exceptional customer success managers. Executive search firms can systematize candidate sourcing and qualification so that recruiters maintain high placement rates without each being an individual superstar. High-ticket coaches can build a Freedom Machine that delivers their methodology at scale without their personal involvement in every interaction.
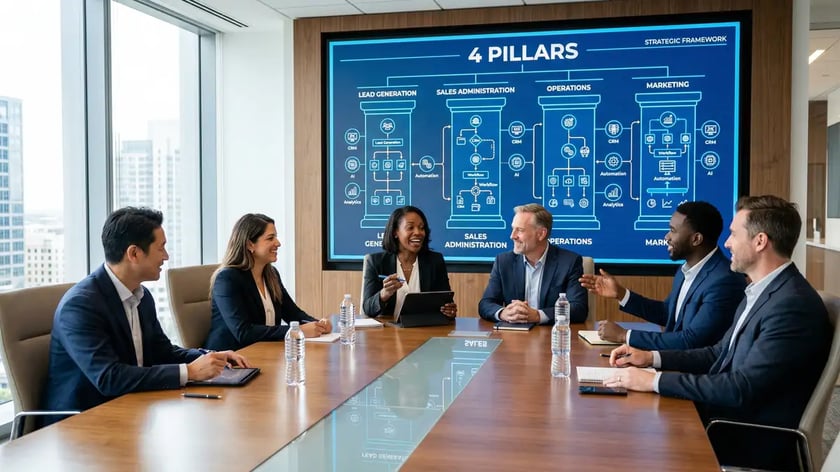
Ready to architect your own Freedom Machine? peppereffect installs AI-powered operating systems that decouple your revenue from your headcount across all four pillars — Lead Generation, Sales, Operations, and Marketing.
Book Your Growth Mapping CallThe Five-Step Blueprint for Engineering Super-Linear Growth
The convergence of evidence from SaaS benchmarking, professional services economics, and AI automation capabilities points toward specific architectural steps for founders committed to achieving super-linear growth. Companies achieving 40% revenue growth with only 12-15% headcount growth have followed a consistent pattern documented by BuildFM research. Here is the blueprint:
Measure Revenue Per Employee as Your North Star Metric
Stop treating absolute revenue growth as the primary indicator. Track revenue per employee monthly alongside your Rule of 40 score. The new benchmark is $500K ARR per employee for "great" — if you are below $200K, your architecture has a structural problem that more hiring will only compound.
Map Where Your Team Spends Time — Then Automate the 60-70%
Consistently, 60-70% of operational time goes to a small number of high-volume, repetitive activities: scheduling, status updates, data entry, report generation. Targeted automation of these categories enables the same team size to achieve 2.5x volume increase without adding a single FTE.
Systematize Before You Scale — Document Every Critical Process
Before hiring the next sales team member, document your sales and proposal process to the point that a competent person without prior experience could execute it successfully. Before scaling customer success, codify your onboarding playbooks into repeatable methodologies. Systems first, headcount second.
Deploy AI as Capital Investment, Not Peripheral Efficiency Tool
Companies seeing $10+ return per AI dollar dedicate up to 64% of their IT budget to AI. Treat AI automation as a primary value driver equivalent to product development — integrated directly into your CRM, sales administration, and fulfillment infrastructure, not bolted onto legacy processes.
Flatten Management Layers and Build Hybrid Human-AI Teams
McKinsey research suggests 10-15% of managerial costs can be saved by rightsizing spans and layers. Google eliminated 35% of small-team managers in their efficiency drive. Deploy agentic AI systems that provide real-time guidance and workflow orchestration directly to individual contributors, reducing the need for supervisory overhead.
The Agentic Era: Why 2026-2028 Is the Inflection Point
The emergence of agentic AI systems designed to autonomously execute multi-step workflows represents the most significant structural shift in this domain. Unlike generative AI systems designed to assist humans in performing tasks faster, agentic AI systems are architected to independently plan, execute, and adapt — with human oversight of outcomes rather than processes. Gartner predicts that by 2028, 33% of enterprise software applications will include agentic AI, up from less than 1% in 2024, enabling 15% of day-to-day work decisions to be made autonomously.
The business implication is that current AI deployment patterns — focused on automating discrete tasks — will evolve toward orchestrating entire workflows. Forrester predicts that in 2026, the top five HCM platforms will offer digital employee management capabilities, treating AI agents as virtual team members within workforce planning systems. Cisco research predicts that by 2028, 68% of all customer service interactions with technology vendors will be handled by agentic AI. This is not automation at the margins — this is structural transformation of how work gets done.
The Deloitte 2026 State of AI report documents that while agentic AI usage is poised to rise sharply, only one in five companies has a mature governance model for autonomous AI agents. This creates a window of competitive advantage: companies that build governance infrastructure now — while agentic AI adoption is still ramping — will establish operational advantages as competitors scramble to implement controls retroactively. The PwC 2026 Global AI Jobs Barometer reinforces the urgency: AI-exposed jobs are changing 66% faster than other jobs, and workers with AI skills command a 56% wage premium — up from 25% the prior year. This wage inflation for AI-skilled workers paradoxically incentivizes companies to deploy autonomous systems to reduce dependency on scarce, expensive talent.
| Prediction | By When | Source |
| 33% of enterprise software includes agentic AI | 2028 | Gartner |
| 15% of day-to-day work decisions made autonomously | 2028 | Gartner |
| 68% of customer service interactions via agentic AI | 2028 | Cisco |
| Top 5 HCM platforms offer digital employee management | 2026 | Forrester |
| AI-exposed jobs changing 66% faster than others | 2025-2026 | PwC |
Sources: Gartner, Cisco, Forrester, PwC
Key Takeaway
The companies that will dominate their markets in 2027-2030 will not be those that hire the most aggressively. They will be the ones that architect hybrid human-AI teams where a 50-person operation delivers the throughput of a 150-person organization. The structural technologies enabling this exist now. The constraint is not technical — it is whether leaders can overcome the deeply ingrained assumption that more revenue requires more people.
Real-World Proof: Companies Achieving Super-Linear Growth
Meta's average revenue per employee jumped 85% over three years through sweeping employee cuts combined with AI-driven advertising and content systems. Rather than growing headcount proportionally with expanding revenue demands, Meta systematically invested in AI systems that allowed dramatically smaller teams to deliver substantially higher output. Google reduced its workforce by 6% (12,000 employees) while subsequently removing 35% of managers overseeing small teams — and its Cloud business experienced record growth despite the smaller overall workforce.
These are not just big-tech stories. Basecamp serves 75,000 companies and 3.3 million users with 171 employees, of which only 37 are engineers (22% of workforce) — compare that to many SaaS companies where engineering represents 30-40% of headcount. This suggests a platform architected for customer self-service and minimal human support. In professional services, Deltek's 2025 benchmarks show revenue per consultant fell to $199,000 and billable utilization dropped to 68.9% — below the 75% optimal threshold. The firms maintaining profitability amid industry-wide decline are those that have deliberately increased leverage through systematic methodology development and knowledge capture.
The pattern across all these examples is consistent. The 2025 B2B SaaS Startup Benchmarks from Lighter Capital document that sales and marketing dollars went half as far to generate revenue in 2025 compared to 2024, while median annual revenue growth slowed to 28% — down 40% from the prior year. Simply adding headcount produces diminishing returns. The median New CAC Ratio rose 14%, reaching $2.00 across SaaS companies — meaning businesses now spend $2 to acquire $1 of new ARR. The only companies improving these economics are those deploying AI-driven lead generation, marketing automation, and qualification systems.
Frequently Asked Questions
What does "decouple revenue from headcount" mean in B2B?
Decoupling revenue from headcount means architecting your business so that revenue grows at a faster rate than your team size. Instead of hiring 30% more people to capture 30% more revenue, you build systems, automated workflows, and agentic AI infrastructure that allow your existing team to handle substantially more throughput. Companies achieving this consistently report 40% revenue growth with only 12-15% headcount expansion, as documented by BuildFM research on operational scaling patterns.
How do you calculate revenue per employee?
Revenue per employee is calculated by dividing total annual revenue by total full-time equivalent employees. For SaaS companies, many practitioners use ARR per FTE as the preferred metric. The 2025 median for private SaaS companies is $129,724, though SaaStr argues that $500K is the new benchmark for "great." Always use fully burdened labor costs (1.25-1.4x salary) when evaluating the true cost side of this equation.
What is a good revenue per employee ratio for B2B companies?
Benchmarks vary significantly by industry and business model. For private SaaS: $129K is median, $200K+ is good, $500K+ is excellent. For professional services: $158K is the global average, with top firms exceeding $250K. The real signal is trajectory — are you improving this metric quarter over quarter? Companies that show consistent improvement in revenue per employee are typically building sustainable operational leverage through process automation and systems architecture.
How can B2B companies scale without hiring more staff?
The proven approach involves three parallel strategies. First, systematize your critical processes using the franchise prototype principle — document everything so ordinary people executing well-designed systems produce extraordinary results. Second, deploy AI automation targeting the 60-70% of team time consumed by repetitive tasks like data entry, scheduling, status updates, and report generation. Third, flatten management layers and build hybrid human-AI teams where agentic workflows handle routine execution and humans focus on judgment, relationships, and strategy.
What role does AI automation play in reducing headcount dependency?
AI automation structurally changes the revenue-to-headcount equation by enabling existing team members to handle dramatically more throughput. McKinsey documents that 57% of U.S. work hours are automatable with current technology. In practical terms, sales reps using AI-driven automation save 2-3 hours daily, HR teams report 70% reduction in manual tasks, and customer service organizations have automated 40-60% of contact volume. The key is treating AI as a capital investment integrated into core workflows — not a peripheral efficiency tool bolted onto legacy processes.
How do high-growth companies maintain margins while scaling?
High-growth companies maintaining margins follow the Rule of 40: growth rate plus profit margin should equal or exceed 40%. The critical variable is operational leverage — growing revenue without proportionally growing headcount or G&A expenses. Companies achieving Rule of 40 scores above 40 have architected their operations for leverage through sales automation, systematized delivery, and rigorous hiring discipline using fully burdened labor costs as the baseline.
What is the difference between scaling with headcount versus scaling with systems?
Scaling with headcount creates linear growth: 30% more revenue requires approximately 30% more people, with margins compressing as overhead cascades. Scaling with systems creates super-linear growth: the same team handles substantially more volume through documented processes, automated workflows, and AI-powered execution. Systems-dependent businesses can replicate capacity without recruiting additional exceptional individuals. People-dependent businesses face a ceiling tied to talent availability, management capacity, and the fragility of key-person dependency.
Stop Scaling Headcount. Start Scaling Systems.
peppereffect installs AI-powered operating systems across all 4 Pillars — Lead Generation, Sales Administration, Operations, and Marketing — that decouple your revenue from your headcount. Our clients achieve 3-5x throughput improvements without proportional team growth.
Book Your Growth Mapping CallLearn About the Freedom Machine → scale revenue without headcount weekly operating dashboard
Resources
- SaaS Capital — 2025 Revenue Per Employee Benchmarks for Private SaaS Companies
- McKinsey Global Institute — Agents, Robots, and Us: Skill Partnerships in the Age of AI
- Microsoft/IDC — 2024 AI Opportunity Study: Top Five AI Trends to Watch
- Gartner — How Intelligent Agents in AI Can Work Alone
- Deloitte — The State of AI in the Enterprise 2026
- BCG — Are You Generating Value from AI? The Widening Gap
- SaaStr — The New Rule: $500K ARR Per Employee Is the New $200K
- BuildFM — Scaling Operations Without Proportionally Increasing Headcount