

Expansion revenue is no longer the polite afterthought tacked onto a mid-market SaaS growth plan. It is the growth plan. Across the industry, expansion ARR now accounts for 40% of total new ARR at $10M–$40M companies, and crosses 58% at the $50M–$100M tier, climbing toward 67% above $100M, according to Benchmarkit's 2025 SaaS Performance Metrics. Yet the median B2B SaaS company still operates at 101% Net Revenue Retention, parked at the floor of the expansion ceiling while elite peers compound at 115%–130%+. The 30–50% valuation premium that NRR >120% commands over identical companies stuck at 100% is not a rounding error — it is the difference between a $100M and a $150M exit, mathematically guaranteed by m3ter's 2026 NRR-to-valuation analysis. Rule of 40 for mid-market SaaS
This article installs the architecture: the five expansion levers, the health-score infrastructure that triggers them, the agentic AI orchestration that compounds them, and the 90-day deployment roadmap a $10M–$40M ARR CEO can execute without scaling headcount. Built for operators who refuse to mistake a 105% NRR for a victory.
Want to see your own CAC against peer benchmarks? Run the CAC Diagnostic for your true CAC, the 30 to 50% reduction agentic deployment delivers, and a board-ready PDF in 60 seconds.
Run the CAC DiagnosticWhy Expansion Revenue Beats New-Logo Sales at Mid-Market Scale

The structural economics of B2B SaaS shift the moment a company crosses $10M ARR. Founder-led pipeline gives way to market-saturation physics: rising CAC, declining win rates, and the hard ceiling that proportional headcount cannot scale margin. The median mid-market growth rate has compressed to 26% in 2026, down from 30% in 2022 (G-Squared CFO). Acquiring the next dollar of new-logo ARR is becoming structurally more expensive while existing accounts sit under-monetised.
Expansion revenue inverts the equation. Win rates on existing accounts run 60–70%, compared to 5–30% on net-new prospects (RevPartners). CAC on expansion is typically 5–10x cheaper than new-logo CAC — and the LTV is structurally higher because the customer is already onboarded, integrated, and producing usage signal. The 2024–2026 industry data has settled the strategic question: at $1M ARR, expansion contributes only 15.4% of net-new MRR; by $20M ARR, top-quartile companies pull 34.7% of net-new MRR from expansion; above $50M, expansion routinely exceeds 50% (ChartMogul Growth Levers Report).
The Mid-Market Inversion
Below $20M ARR, expansion is a tactic. Above $20M ARR, expansion is the architecture. Companies that fail to systematise expansion to ≥40% of new ARR by $20M will not have the unit economics, predictability, or capital efficiency to scale to $50M without catastrophic CAC inflation. This is not opinion — it is the median path observed across 6,525 SaaS companies in the ChartMogul dataset.
The NRR Plateau: Why 105% Feels Comfortable and Costs You $50M at Exit
Net Revenue Retention is the single most predictive metric of long-term SaaS valuation, but the 2026 distribution exposes a dangerous comfort zone. The market is bifurcated: companies achieving expansion escape velocity, and companies plateauing beneath the ceiling.
| NRR Tier | Range | % of B2B SaaS | Implication |
| Floor | ≤100% | ~50% | Net churn — expansion failing to offset losses |
| Plateau | 101–110% | ~30% | False comfort — stuck below escape velocity |
| Top performer | 111–120% | ~15% | Compounding advantage; healthy multiple |
| Elite | >120% | ~5% | 30–50% valuation premium; capital-efficient growth |
Sources: G-Squared CFO 2026 SaaS Benchmarks, Monetizely 2025 SaaS Pricing Benchmarks, m3ter NRR & Valuations 2026.
The valuation math is unforgiving. In 2026 capital markets, a SaaS company at 100% NRR trades at 6–8x ARR; the same company at 120%+ NRR commands 10–12x ARR. A 10-point NRR lift translates to a 20–30% valuation uplift at constant ARR and growth rate (m3ter). At $30M ARR, that is a $50M–$90M difference at exit, generated entirely by the architecture of the expansion engine — not the size of the sales team. Your Net Revenue Retention metric is not a passive readout. It is a leading indicator of the architecture you have or have not installed.
The Five Expansion Levers
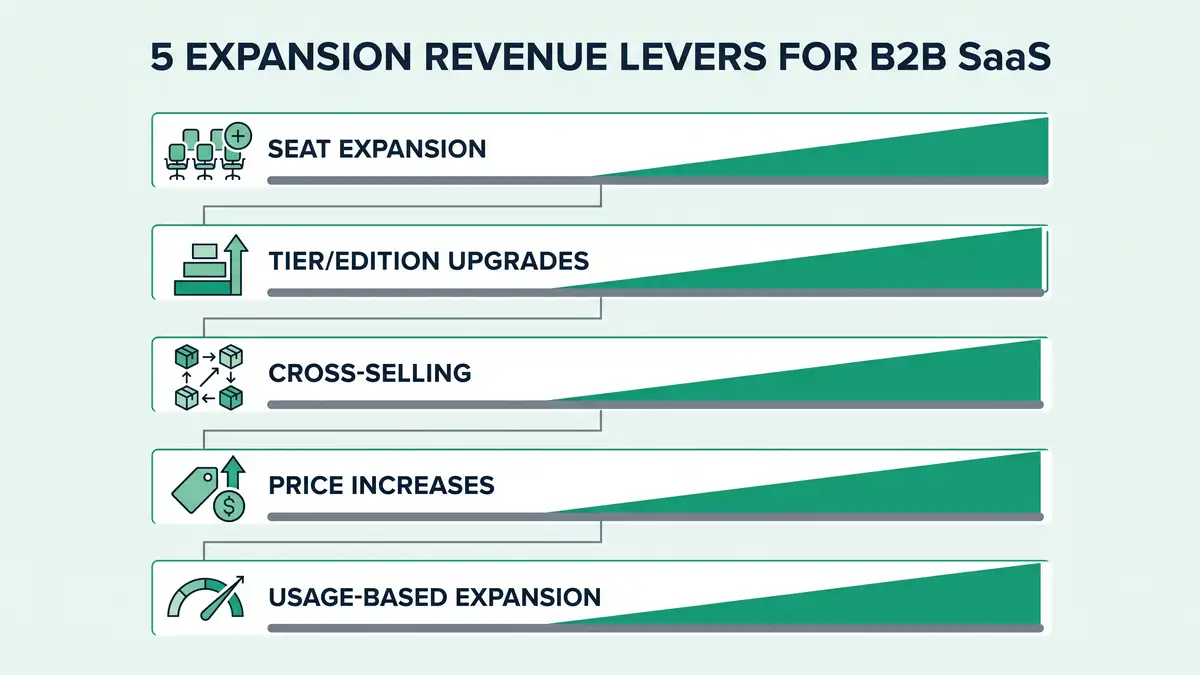
Every dollar of expansion revenue flows through one of five levers. A coherent expansion revenue strategy deploys all five — not the lazy default of seat-based upsell alone — and engineers each as an autonomous logic-gated workflow rather than a manual sales motion.
Seat & User Expansion
Per-seat license growth as users join the customer's organisation or as adoption deepens within existing teams. Mechanically the simplest lever; strategically the most exposed in the AI era. Per-seat expansion is shrinking as AI agents replace human seats in customer organisations. Still essential at $10M–$40M ARR, but cannot be the only lever.
Tier & Edition Upgrade
Customers move from Starter → Growth → Enterprise as feature needs mature. Effective when feature gating maps to genuine value milestones; corrosive when "Good-Better-Best" forces customers into tiers that don't match their workflow. Done well, tier upgrade compounds at 8–15% of base ARR annually.
Cross-Product & Module Adoption
Customer adopts adjacent product lines or modules. The highest-LTV lever at scale: 86% of $100M+ SaaS companies use three or more pricing dimensions, a structural design that engineers cross-sell from day one (Monetizely). Companies using multi-dimensional pricing show 34% higher LTV/CAC than single-dimension peers.
Price Optimization
Annual list-price increases of 3–7% (or aggressive 8–12% for AI-bundled tiers). In 2025, price increases accounted for 6.3 of 8.7 percentage points of total ARR growth — 72% of growth came from price, not new logos or expansion units (SaaStr 2025 Price Surge analysis). The cleanest expansion lever you have, executed quarterly with grandfathering logic to protect retention.
Usage / Consumption Expansion
Revenue grows automatically as customer usage grows — API calls, transactions, GB stored, AI tokens consumed. Hybrid pricing models blending subscription with usage-based and outcome-based components achieve 38% higher NRR than pure-seat models (SaaSMag Hybrid Pricing 2026). Usage-based expansion accounts for 40–50% of new ARR at scale vs 5–10% for pure-seat — the single highest-leverage architectural decision in the playbook.
Architecture Decision
The shift from one-lever (seat) to multi-lever (seat + tier + module + price + usage) expansion is the single highest-ROI strategic move available to a $10M–$40M ARR SaaS CEO in 2026. 68% of high-growth SaaS now uses value-based pricing with sophisticated value metrics; pure cost-plus and competitor-based pricing models have been deprecated by the market (Monetizely 2025).
Diagnose which expansion levers your company has — and which it has not — installed.
Book a Growth Mapping CallThe Health-Score Engine: Input Layer of the Expansion System
Levers without signals are guesses. The architectural prerequisite for systematic expansion is a continuously-updated customer health score that triggers playbook activation the moment usage or behavioral signals cross threshold — not at quarterly QBR cadence, not at renewal, not when a CSM "feels like checking in."
A production-grade health score blends weighted inputs across five dimensions: product usage depth, feature adoption breadth, support sentiment, payment health, and engagement frequency (Vitally Customer Health Score architecture). For expansion specifically, the score must extend with three further inputs: usage-trajectory delta (is consumption accelerating?), seat-saturation ratio (is the customer hitting their license cap?), and product-adjacency signal (are they invoking features that map to a higher tier or adjacent module?).
| Signal Layer | Input | Trigger Threshold | Playbook Activated |
| Usage trajectory | 30-day rolling consumption delta | ≥20% acceleration | Tier upgrade outreach |
| Seat saturation | Active seats / licensed seats | ≥85% | Seat expansion sequence |
| Feature adjacency | Use of feature requiring upgraded tier | ≥3 invocations / 30 days | Tier or module cross-sell |
| Champion movement | LinkedIn / Hubspot CRM signal | Role change in account | Re-onboarding + expansion plan |
| Renewal proximity | Days to renewal | 120–90 days out | Multi-year + expansion bundle |
Sources: Gainsight Customer Success Metrics 2026, Totango customer-led expansion playbook.
The trigger architecture matters more than the score itself. A health score that nobody acts on is decoration. The signal-to-playbook handoff must be deterministic: when threshold X is crossed, sequence Y fires, owner Z is notified, and the system records the outcome — without manual queue review. This is where most mid-market companies fail. They have a Salesforce dashboard called "expansion opportunities" that nobody reviews because it is not wired into the daily operating cadence.
Agentic AI as the Orchestration Layer

The expansion playbook has become an AI orchestration problem, not a CSM staffing problem. Agentic AI compresses the time between signal detection and playbook activation from weeks (manual CSM review cadence) to seconds (autonomous trigger). Specific 2026 deployments are demonstrating measurable outcomes: AI agents reducing CSM administrative load by 40–60%, prioritising expansion outreach with 30%+ higher conversion than manual prioritisation, and forecasting renewal/expansion outcomes with 85%+ accuracy 60 days out (Pedowitz Group AI Renewal Forecasting, Gong Retention Forecasting).
The orchestration architecture deploys at least four agent roles, each owning a specific node in the expansion lifecycle:
- Signal Detection Agent — continuously ingests product usage, support tickets, payment events, CRM activity, and external signals (LinkedIn, news), and updates the customer health score in real time.
- Playbook Routing Agent — when a threshold trips, decides which playbook to fire (tier-upgrade, seat-expansion, cross-sell, price-optimization, win-back), assigns owner, and drafts the outreach sequence.
- Execution Agent — runs the outreach sequence: drafts emails personalized to the customer's usage data, books QBR meetings, generates expansion proposals from templates, updates CRM stages.
- Forecasting Agent — rolls expansion-pipeline data into board-grade forecasts, flags accounts at risk of slipping, and runs continuous what-if scenarios for pricing changes.
This is not a future-state hypothesis. 2025 industry data documents agentic deployments materially compressing expansion cycle time and lifting conversion, with McKinsey's analysis of AI-era software models identifying expansion orchestration as one of the highest-impact AI investments mid-market SaaS can make. Companies who treat Customer Success automation as a productivity gain miss the strategic point — it is the structural shift from CSM-as-account-manager to CSM-as-strategist with autonomous agents handling the execution layer.
Five Failure Modes That Cap Expansion at 105% NRR
Architecture matters more than effort. The following five failure modes account for the majority of mid-market companies stuck in the 100–110% NRR plateau.
Failure 1 — Pricing Inelasticity & Feature-Gating Mistakes
The "Good-Better-Best" tier model is flawed in execution: customers cluster in the middle tier, top tier feels punitive, and the gap between Good and Better creates resentment rather than upgrade pressure (Monetizely on GBB pricing risks). Worse: gated features rarely map to genuine value milestones — they reflect what the product team built, not what the customer is willing to pay more for.
Failure 2 — Expansion Tied to the Renewal Cycle
Expansion conversations once a year, when the contract is up, mean 11 months of foregone revenue and a single high-stakes negotiation that risks both expansion and renewal. Continuous expansion (triggered by health-score signals) decouples expansion from renewal pressure and compounds throughout the year.
Failure 3 — CSM Compensation Misalignment
If the CSM is paid on retention only (and not expansion), the role becomes risk-averse account stewardship. The fix is variable comp tied to expansion ARR, not just renewal — but only after the playbook infrastructure exists to make expansion repeatable rather than dependent on individual CSM hustle (Everstage CSM Variable Comp Guide 2026).
Failure 4 — No Health-Signal Infrastructure
Without continuous signal capture, expansion is reactive: triggered by quota pressure on the AM, by customer-initiated requests, or by random discovery in QBRs. Reactive expansion is structurally capped at ~5–10% of ARR. Signal-driven expansion routinely doubles that.
Failure 5 — Feature-Parity vs Value-Differentiation
If the higher tier is feature parity with the lower tier "plus a few things," upgrade pressure is weak. If the higher tier represents a genuinely different value proposition (for a different buyer or use case), upgrade conversion compounds. Monetizely data shows the difference is 2–3x in tier-upgrade conversion rate.
The 90-Day Expansion Revenue Deployment

The system installs in four sequenced phases over 90 days. The order matters: signal infrastructure before playbook design; playbook design before agent automation; automation before sales enablement. Companies that skip phases produce expensive dashboards that nobody acts on.
| Phase | Days | Outcome | Success Metric |
| Pre-launch | 1–14 | Data audit, ICP segmentation, baseline NRR/expansion-share measurement | Baseline locked; data quality verified |
| Phase 1: Health score & triggers | 15–30 | Health-score model deployed; trigger thresholds calibrated; playbooks mapped | Score live across 100% of customers; 5 trigger sequences active |
| Phase 2: Playbook & enablement | 31–60 | 5 expansion playbooks documented; CSM/AM trained; comp restructured | Playbook activation rate >70%; CSM expansion ARR baseline set |
| Phase 3: Agentic automation | 61–80 | Signal-detection, routing, execution agents deployed; CRM integrated | 40%+ CSM time reclaimed; cycle time -50% |
| Phase 4: Go-live & optimization | 81–90+ | Production monitoring; weekly tuning; quarterly playbook review | NRR uplift 4–8 points; expansion ARR up 25–40% YoY pace |
Sources: Weflow 90-Day RevOps Plan, ICONIQ 2025 Year in Review, Gainsight QBR Guide.

The 90-day window is not optimistic — it is what disciplined execution looks like when the leadership team decides expansion is the architecture, not a tactic. The compounding effect is what makes the math work: a company that lifts NRR from 105% to 115% in year one will, by year three, be operating at a 30%+ valuation premium and a substantively lower CAC payback than peers still chasing the new-logo treadmill. The compounding does not require that you stop acquiring new logos. It requires that you stop pretending new-logo growth alone will get you to $50M ARR without breaking your unit economics.
The integration with adjacent infrastructure — your SaaS unit economics framework, your CAC reduction levers, your MRR optimization plan, and your B2B pricing strategy — is non-negotiable. Expansion is not an isolated initiative. It is the connective tissue of the operating system that decouples revenue from headcount.
Bottom Line
Expansion revenue is the highest-ROI growth lever available to a $10M–$40M ARR B2B SaaS CEO in 2026. The five-lever architecture (seat, tier, cross-sell, price, usage) deployed on a health-score signal layer with agentic AI orchestration is the system. The 90-day roadmap is the install. The 30–50% valuation premium that 120%+ NRR generates is the financial outcome. The CEO's job is not to hire more sales reps. It is to install the operating system that compounds expansion revenue faster than new logos. Companies that miss this transition will plateau at $25M–$35M ARR with eroding unit economics. Companies that complete it will compound to $50M+ on the same headcount.
Install the Expansion Revenue Operating System
peppereffect architects the five-lever expansion infrastructure — health-score signal layer, agentic AI orchestration, playbook automation — for $10M–$40M ARR B2B SaaS CEOs ready to lift NRR from 105% to 120%+ without scaling headcount. Diagnostic call. Architectural blueprint. 90-day deployment.
Book Your Growth Mapping CallSee the Sales Automation Architecture →
Frequently Asked Questions
What is expansion revenue in B2B SaaS?
Expansion revenue is incremental annual recurring revenue (ARR) generated from existing customers through five levers: seat/user expansion, tier or edition upgrade, cross-product or module adoption, price optimization, and usage-based consumption growth. It is measured separately from new-logo bookings and is the primary driver of Net Revenue Retention above 100%.
What's a good Net Revenue Retention rate for B2B SaaS?
The 2026 median NRR is 101%. Top performers achieve 111%+, and elite operators reach 120–130%+. For a mid-market $10M–$40M ARR company, 110%+ should be the floor target and 120% the operating ambition. Below 100% means net churn is overwhelming expansion — a structural unit-economics problem, not a sales-team problem.
What's the difference between upselling and cross-selling?
Upselling moves a customer to a higher tier or edition of the same product (Lever 2 in the framework). Cross-selling adds a different product or module to the customer's account (Lever 3). Cross-selling typically generates higher LTV and stickier accounts but requires a multi-product portfolio. Upselling is mechanically simpler and works in single-product companies.
How is expansion MRR calculated?
Expansion MRR equals the additional MRR from existing customers in a given period — new seats added, tier upgrades, new modules adopted, price increases applied, and usage overages — minus contraction MRR (downgrades). It does not include new-logo MRR. The formula is: Expansion MRR = Σ(MRR Lift from upsell + cross-sell + seat add + price + usage growth) across active customers (Custify formula reference).
What is the land-and-expand strategy?
Land-and-expand is the GTM motion of acquiring a customer with a small initial deal (the "land") and then systematically growing the account through the five expansion levers (the "expand"). Companies executing this well have low initial deal sizes and rapid expansion velocity, with expansion ARR exceeding the original deal value within 18–24 months. It requires a deliberate architecture, not just sales effort.
When should a SaaS CEO prioritize expansion over new-logo acquisition?
Architecturally, both should run in parallel — but the resource allocation should shift toward expansion as the company crosses $10M ARR. By $20M ARR, ≥40% of new ARR should come from expansion; below this threshold, the company is over-indexed on new-logo CAC and will plateau before $50M. The decision is not "either/or" — it is the proportional weighting of the operating model, which most mid-market CEOs get wrong by 15–20 percentage points.
How much can agentic AI lift expansion revenue?
2025–2026 deployments document 30%+ higher expansion conversion from AI-prioritized outreach, 40–60% reduction in CSM administrative time, and 85%+ accuracy in 60-day expansion forecasting. The structural shift is from CSM-as-account-manager (manual review, quarterly cadence) to CSM-as-strategist (autonomous agents handling signal-detection, routing, execution; humans handling judgment calls and high-stakes negotiation). customer success KPIs that predict retention churn root-cause analysis predictive customer health scoring customer retention strategy product adoption strategy QBR commitment loop annual contract value
Resources
- Benchmarkit — 2025 SaaS Performance Metrics Benchmark
- G-Squared CFO — SaaS Benchmarks 2026
- ChartMogul — Growth Levers: The Path from $1M to $20M ARR
- m3ter — Net Revenue Retention and SaaS Valuations 2026
- Monetizely — SaaS Pricing Benchmarks 2025
- SaaSMag — Hybrid Pricing in SaaS 2026
- SaaStr — The Great SaaS Price Surge of 2025
- McKinsey — Upgrading Software Business Models for the AI Era
- Gainsight — Customer Success Metrics to Track in 2026
- Totango — Activate Customer-Led Growth for Expansion
- Gong — Retention Forecasting for Revenue Growth
- Pedowitz Group — Renewal & Expansion Forecasting with AI
- RevPartners — The Hidden Costs of Chasing New Logos
- Custify — Expansion MRR Formula and Benchmarks
- ICONIQ — 2025 Year in Review
- Bain & Company — Technology Report 2025


