

The median B2B SaaS company now spends $2.00 in sales and marketing to acquire $1.00 of new annual recurring revenue — a structural inefficiency that has quietly turned customer acquisition cost into the single most important metric on the scaling CEO's dashboard. Average blended CAC for B2B SaaS has climbed to roughly $1,200 in 2026, with bottom-quartile performers burning $2.82 per dollar of new ARR. For any company operating between $10M and $40M ARR, the difference between a healthy CAC ratio and a broken one is the difference between a self-funding growth engine and a quarterly cash crisis.
This guide unpacks customer acquisition cost end-to-end: the three-tier calculation framework most executives get wrong, the 2026 benchmarks by stage, ACV, channel and industry, the LTV:CAC and payback period thresholds that actually matter, and the five evidence-based levers that compound CAC reduction without starving growth velocity.
Key Takeaway
Customer acquisition cost is not a single metric — it's a three-tier calculation (Paid, Blended, Fully-Loaded) that must be segmented by channel, ACV band and customer cohort to drive strategic decisions. Companies that operate with blended CAC alone make budget decisions blind. Companies that engineer their acquisition mix toward partners, content and AI-powered sales development cut CAC by 30–50% while accelerating deal velocity.
What Is Customer Acquisition Cost (CAC)?
Customer acquisition cost is the total investment — sales, marketing, tooling, personnel and overhead — required to convert a prospect into a paying customer. At its simplest, CAC = Total Acquisition Spend ÷ New Customers Acquired over the same period. At its operationally useful, CAC is a segmented, time-matched, fully-loaded metric that reveals the true economics of your go-to-market engine.
The reason CAC matters more in 2026 than at any prior point in the SaaS era is structural: buyer independence has climbed (70% of B2B research happens before vendor contact), buying committees have grown to an average of 17 stakeholders for enterprise deals, and procurement is now involved in 53% of buying cycles from the outset. Each of these shifts extends sales cycles and inflates the fully-loaded cost of winning a logo. A company still calculating CAC the way it did in 2021 is almost certainly under-reporting true acquisition cost by 20–40%.
CAC is also the denominator in the two most consequential unit economics ratios — LTV:CAC and CAC Payback Period — which together determine whether a SaaS company can scale profitably or is engineering its own insolvency in slow motion. Before any reduction strategy matters, the calculation itself must be right.
The Three-Tier CAC Calculation Framework
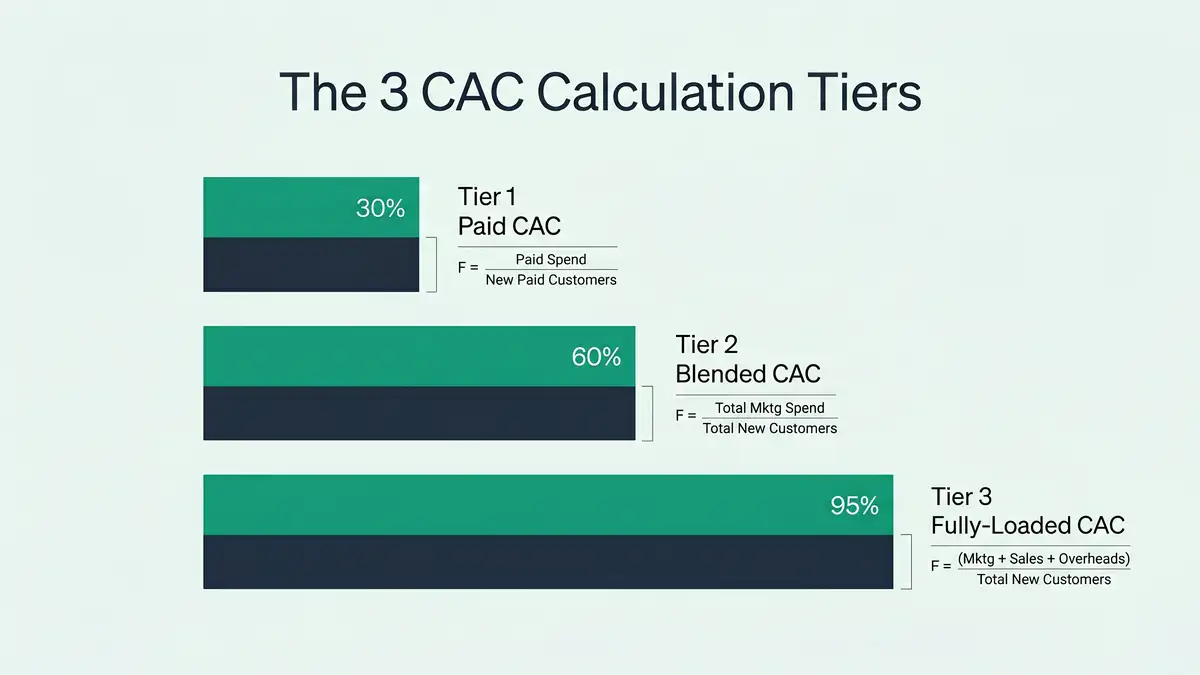
Most executives quote a single CAC number and stop. That number is almost always either misleadingly low (Paid CAC) or uselessly general (unsegmented Blended). The three-tier framework below is how operationally-mature SaaS companies calculate the metric.
Paid CAC — Marketing Spend Only
Formula: (Paid Media + Tools + Agency Fees) ÷ New Customers Acquired. This is the simplest tier — raw ad spend and martech cost divided by new logos. It is useful for channel-level comparisons (Google Ads vs. LinkedIn) but systematically understates the true cost of acquisition because it excludes every human in the funnel. Finance teams relying on Paid CAC typically report numbers 50–70% below Fully-Loaded.
Blended CAC — The Industry Standard
Formula: (Total Sales & Marketing Spend in Period) ÷ (New Customers Acquired in Same Period). Includes paid media, sales team base + variable comp, marketing team salaries, events, content production and revenue operations. This is the metric referenced in most public benchmarks and what your board will want to see. The trap: if you blend new-logo revenue with expansion revenue in the denominator, you mask deterioration in new-customer efficiency behind strong NRR performance.
Fully-Loaded CAC — The Truth Metric
Formula: (All Acquisition-Related Costs — including benefits, taxes, management overhead, office/infrastructure allocation, onboarding tools, CS portion dedicated to closing) ÷ New Customers. This is what a private equity acquirer will calculate during diligence, and it is the only number that reliably predicts whether your acquisition engine is solvent at scale. Fully-Loaded CAC is typically 30–50% higher than Blended.
Source: MetricKit — Blended CAC Guide, Optif — Fully-Loaded CAC Definition
The practical discipline is to calculate and report all three tiers on a single dashboard. Paid CAC tells you channel efficiency. Blended tells you where you sit against market. Fully-Loaded tells you whether you have a business. Companies that deploy this three-tier discipline alongside a systematic SaaS unit economics framework catch acquisition deterioration six to nine months earlier than peers who track a single number.
Common Calculation Error
Never use trial signups or MQLs as the denominator. If 1,000 trial signups cost $100 each and 15% convert to paid, your actual CAC is $667 per paying customer, not $100. The correct denominator is always new paying customers — leads, signups and MQLs are top-of-funnel metrics, not acquisition cost.
Want to see your own CAC against peer benchmarks? Run the CAC Diagnostic for your true CAC, the 30 to 50% reduction agentic deployment delivers, and a board-ready PDF in 60 seconds.
Run the CAC DiagnosticB2B SaaS CAC Benchmarks for 2026
CAC varies dramatically by company stage, ACV band, industry vertical and acquisition channel. The benchmarks below are synthesised from First Page Sage's 2024 industry report, Benchmarkit's 2025 SaaS Performance Metrics dataset and multiple channel-efficiency studies. Use them to locate where your company sits — and where it should be.

The single most important benchmark for a $10M–$40M ARR scaling company is not the median — it is year-over-year trajectory. The median has deteriorated significantly since 2022, meaning "at benchmark" today means "worse than benchmark 18 months ago." What determines whether your acquisition engine is healthy is whether your CAC ratio is improving or worsening relative to your own prior periods.
Before comparing against an industry average, segment your own data by channel, customer size and ACV band. A $1,500 blended CAC might hide an $800 SMB cohort and a $3,000 enterprise cohort — two completely different businesses masquerading as one number. Benchmarking without segmentation produces worse decisions than no benchmarking at all.
CAC by Company Stage
| Stage (ARR) | Median CAC | Top-Quartile CAC | Payback Period (Median) |
| Pre-seed / <$2M (PLG/self-serve) | $300–$800 | <$400 | 6–9 months |
| Series A / $2M–$10M | $800–$1,500 | $600–$900 | 9–15 months |
| Growth / $10M–$50M | $1,200–$2,500 | $1,000–$1,500 | 12–18 months |
| Enterprise / $50M+ | $2,500–$6,000 | ≈$2,500 | 18–24+ months |
Source: First Page Sage — B2B SaaS CAC 2024 Report, SaaSHero — 2026 CAC Benchmarks
CAC by Annual Contract Value (ACV)
| ACV Band | Median CAC | Typical GTM Model | Payback (Median) |
| <$5,000 ACV | $200–$600 | Self-serve / PLG | 6–12 months |
| $5,000–$25,000 ACV | $1,200–$2,000 | Inside sales / hybrid | 12–18 months |
| $25,000–$100,000 ACV | $1,500–$2,500 | Mid-market sales-led | 14–22 months |
| $100,000+ ACV | $2,500–$6,000+ | Enterprise sales-led | 18–24+ months |
Source: Benchmarkit — 2025 SaaS Performance Metrics, SaaSHero — LTV:CAC Benchmarks
The non-obvious insight: there is no meaningful CAC difference between a $5K–$10K ACV product and a $10K–$25K product, but there is a dramatic inflection at the $50K threshold. Companies priced at $10K–$25K face the worst of both worlds — they need enterprise sales infrastructure but lack the deal size to fund it efficiently. This is where you see CAC ratios of 1.5–2.0, perilously close to the profitability waterline. Understanding your exact average revenue per user and ACV positioning is prerequisite to interpreting any CAC benchmark.
CAC by Channel
| Channel | Median CAC | Payback | Best For |
| Partner / Referral | $150 | 6–9 months | All stages; highest-quality leads |
| Inbound Marketing | $200 | 8–12 months | All stages; demand building |
| Content / SEO | $205–$480 | 12–24+ months (compounding) | Long-term investment |
| Events / Conferences | $500–$600 | 12–18 months | Brand building, pipeline |
| Paid Search (SEM) | $802 | 8–14 months | Early-mid stage; immediate traffic |
| Paid Social (LinkedIn, etc.) | $1,200–$2,000 | 10–18 months | Brand awareness, mid-market |
| Outbound Sales (SDR/AE) | $1,980 | 12–18 months | High-ACV, enterprise deals only |
Source: Phoenix Strategy Group — 2025 Channel CAC Benchmarks, Dan Siepen — SaaS CAC Reduction Strategies
The channel mix is the single highest-leverage strategic decision in CAC management. A company allocating 40–50% of budget to inbound and partnerships typically operates at 30% lower overall CAC than a company weighted 70% toward outbound sales. This is not a marginal optimization — it compounds across every cohort.
Where does your CAC actually sit? Map your three-tier calculation against the benchmarks above with a Growth Mapping Call.
Book Your Growth Mapping CallLTV:CAC Ratio and Payback Period — What Healthy Looks Like

CAC in isolation is meaningless. The two ratios that matter are LTV:CAC (lifetime value divided by acquisition cost) and CAC Payback Period (months to recover acquisition spend from gross profit). Together they answer the only question that matters: is this acquisition engine creating or destroying enterprise value?
The 3:1 LTV:CAC threshold is the canonical benchmark — a customer must generate three times the cost of acquiring them over their lifetime to fund the go-to-market engine, maintain operating leverage and produce margin. Below 3:1 you are losing money on growth even if top-line ARR accelerates. Elite companies target 4:1 or higher, which creates the cash surplus required to reinvest into defensive moats — R&D, retention and brand — rather than continuously topping up the acquisition pump. Above 5:1, you are typically under-investing in growth and leaving market share on the table.
CAC Payback Period is arguably more operationally useful than the LTV ratio because LTV depends on churn assumptions that can be gamed. Payback is concrete: how many months of gross profit does it take to pay back the acquisition spend on a single customer? The 2026 benchmarks are 12 months for best-in-class growth-stage SaaS, 18 months for healthy median performance, and anything beyond 24 months indicating structural impairment. A CAC Payback of 12 months means every customer you acquire is self-funding the next one within a year — a true growth flywheel. A 24-month payback means you are financing growth from equity dilution, not operating cash.
The Magic Formula
Operational health requires: LTV:CAC ≥ 3:1, CAC Payback ≤ 18 months, and Net Revenue Retention ≥ 110%. Miss any one and the acquisition engine is leaking value. Hit all three and you have a self-funding growth machine. Tracking net revenue retention as a compounding lever is how elite SaaS companies turn retained customers into the primary source of CAC offset.
Five Evidence-Based Levers to Reduce CAC

Reducing CAC without sacrificing growth velocity is the central operating challenge for every $10M–$50M ARR B2B SaaS company. The five levers below are ranked by impact magnitude and executability — together they routinely deliver 30–50% CAC reduction within 12–18 months when systematically deployed.
AI-Powered Sales Development (10x Efficiency Multiplier)
AI SDR platforms deliver per-lead cost of approximately $39 versus $262 for a human SDR — an 85% cost reduction — while operating at 10–20x the volume. The fully-loaded cost of one human SDR is $139K–$150K annually (base, variable, benefits, tools, management overhead); an AI SDR platform ranges from $11K–$120K annually and scales without hiring ramp. Early implementations of agentic workflows (AI orchestrating multi-step prospecting, personalization and sequencing autonomously) report 77% more revenue per sales rep compared to non-AI teams. Deploy this via our AI agent for sales architecture to convert your outbound motion from a headcount-limited line item into an autonomous system.
Partner & Ecosystem Channel Expansion (30% Blended CAC Reduction)
Partner-sourced customers cost 25% less to acquire (≈$600 partner CAC vs. $800 direct) and close 25% faster. By 2026, approximately 60% of global SaaS revenue is projected to flow through partner-driven models — direct channel partnerships, cloud marketplaces (AWS, Azure, GCP) and technology integrations. If partners represent less than 15% of your new revenue today, you are leaving 30–40% of your addressable market on longer, more expensive acquisition paths. Build referral, reseller and marketplace channels in parallel — they compound.
Content & Organic Compounding (2x Long-Term CAC Advantage)
Organic B2B SaaS CAC averages $942 compared to $1,907 for paid — a near-50% reduction when measured across customer lifetime. More importantly, organic CAC compounds: $100K invested in content generates customers in year one and continues generating in years two and three at declining marginal cost, while $100K of paid media generates customers only during the spend period. The discipline requires 12+ months of committed investment before compounding kicks in — companies operating on quarterly OKR cycles systematically under-invest here and pay the penalty through inflated CAC into perpetuity. A systematic B2B lead generation architecture deliberately balances paid acquisition with compounding organic channels.
Product-Led Growth & Trial Conversion Optimization
Pure PLG companies achieve CAC of $100–$500 versus $5,000–$50,000 for pure sales-led motion — a 10–50x efficiency improvement. For established mid-market companies, the practical lever is trial conversion rate improvement rather than wholesale PLG transition. Industry median trial conversion is 12–15%; top performers achieve 25–30%. Moving from 12% to 18% — a 50% relative improvement — drops effective CAC by 33% because you convert more customers from the same trial acquisition spend. Optimizations include shorter time-to-first-value, in-app guidance, role-segmented trial experiences, and aggressive post-trial win-back (nearly 50% of eventual conversions happen after the formal trial expires).
Expansion Revenue as CAC Offset (The Quiet Compounder)
A customer paying $10,000 annually who expands to $12,000 generates $2,000 in new ARR with zero marginal acquisition cost. Net Revenue Retention above 110% directly dilutes blended CAC by increasing the revenue denominator without corresponding spend. Companies at 120%+ NRR effectively run a second acquisition engine inside their existing base — with better unit economics than any outbound motion. The tactical implementation is systematic lead nurturing infrastructure that extends post-sale into expansion motion, plus product-led upgrade triggers and customer success accountability for net-retention targets.
Source: Autobound — AI SDR Buying Guide 2026, T2D3 — B2B SaaS Performance Metrics 2025, Prospeo — CAC Payback Benchmarks
The levers compound. A company that deploys AI-powered sales development plus meaningful partner channel expansion plus systematic organic investment typically sees blended CAC fall 40–60% within 18 months — not through cost-cutting but through structural redesign of the acquisition engine. This is what a properly architected sales automation system is designed to produce.
Common CAC Calculation Mistakes That Destroy Strategic Decisions

Five recurring errors corrupt CAC reporting and drive bad capital allocation. Each has been observed repeatedly in diligence, board review and recovery engagements with scaling SaaS companies in the $10M–$50M ARR band.
Mistake 1 — Excluding fully-loaded costs. Reporting Blended CAC as if it were Fully-Loaded. True CAC includes benefits, taxes, management overhead, office/infrastructure allocation and the customer success time dedicated to closing. Fully-Loaded is typically 30–50% higher than Blended. Decisions made on Blended alone will systematically over-invest in channels that look efficient on paper.
Mistake 2 — Time-period mismatch. Counting Q1 marketing spend against Q1 new customers when the average sales cycle is 90 days. The customers closing in Q1 were generated from Q4 spend. Fix this with cohort-based attribution that matches spend to the downstream closing period, not the current quarter.
Mistake 3 — Blending new and expansion revenue. Dividing total S&M spend by total new ARR (new logos + expansion) produces a flattering but useless number. Expansion has 30–50% lower CAC structure than new-logo acquisition. Report the two separately — new customer CAC, expansion CAC, and blended CAC — on every dashboard.
Mistake 4 — Using leads or signups as the denominator. As covered earlier: a $100 cost-per-signup at 15% conversion is a $667 CAC, not a $100 CAC. Leads, MQLs and trials are top-of-funnel metrics. Only new paying customers belong in the denominator.
Mistake 5 — No segmentation. A $1,500 blended CAC might hide $500 SMB CAC and $3,000 enterprise CAC — two completely different go-to-motion with different budget priorities. Segment by channel, customer segment and ACV band on every report. Companies that discover their most profitable segment (highest LTV:CAC) is not their largest by revenue routinely find a portfolio-rebalancing opportunity worth 100+ basis points of margin.
Frequently Asked Questions
How do I calculate customer acquisition cost for B2B SaaS?
Use the three-tier framework: Paid CAC (paid media + martech ÷ new customers), Blended CAC (all S&M spend ÷ new customers), and Fully-Loaded CAC (all acquisition-related costs including benefits, overhead and allocated CS ÷ new customers). Report all three on a single dashboard and segment by channel, ACV band and customer segment. The formula you quote in board meetings should be Fully-Loaded Blended CAC with cohort-based attribution that time-matches spend to the sales cycle length.
What is a good LTV:CAC ratio for B2B SaaS?
The canonical benchmark is 3:1 as the floor, 4:1+ as elite. Below 3:1 you are unprofitable on growth even when top-line ARR accelerates. Above 5:1 typically indicates under-investment in acquisition — you are leaving market share on the table. Pair LTV:CAC with a 12–18 month payback period as your combined health check; ratios alone can be gamed through aggressive churn assumptions, but payback is concrete.
What is CAC payback period and what should mine be?
CAC Payback Period = months to recover acquisition cost from gross profit on a single customer. 2026 benchmarks: ≤12 months is best-in-class for growth-stage SaaS, 12–18 months is healthy median, 18–24 months is acceptable for enterprise ACV with strong NRR, and 24+ months indicates structural impairment requiring immediate intervention. Payback is arguably more operationally useful than LTV:CAC because it is not dependent on churn assumptions.
Should I include salaries and benefits in my CAC calculation?
Yes — for Blended and Fully-Loaded CAC. Exclude salaries only in Paid CAC (which is a channel-efficiency metric, not a full acquisition metric). Include sales team base compensation + variable, marketing team salaries, and the portion of revenue operations and leadership time dedicated to acquisition. Fully-Loaded adds benefits, payroll taxes, software licenses, management overhead and allocated facilities cost.
How often should I recalculate CAC?
Monthly at minimum for trend monitoring; quarterly for board reporting with cohort analysis. Rolling 90-day CAC smooths the noise better than point-in-time snapshots. Flag any month where CAC moves more than 15% from the trailing 90-day average for investigation — it is almost always the leading indicator of either channel saturation, sales cycle elongation or a conversion funnel break upstream.
What is the difference between blended CAC and fully-loaded CAC?
Blended CAC includes sales and marketing spend — salaries, media, events, tools, agency fees. Fully-Loaded CAC additionally includes benefits, payroll taxes, management overhead, allocated facilities and infrastructure, and the portion of customer success time dedicated to closing. Fully-Loaded is typically 30–50% higher than Blended and is the number private equity will use in diligence.
How can AI reduce customer acquisition cost?
AI reduces CAC through three mechanisms: (1) AI SDR platforms cut per-lead cost by 85% ($39 vs. $262 for human SDRs) and operate at 10–20x the volume; (2) agentic workflows orchestrate prospecting, personalization and sequencing autonomously, reporting 77% more revenue per rep; (3) AI-powered lead scoring and routing improves conversion rates at every funnel stage. Early-adopter companies deploying these systems now are achieving 20–30% CAC reduction within 12 months, as documented in our SaaS CAC reduction playbook.
The Strategic Conclusion
Customer acquisition cost is not a reporting metric — it is the single clearest diagnostic of whether a B2B SaaS company has a scalable business model. The median CAC ratio of $2.00 per $1 of new ARR tells you that most companies do not. The companies that will win the next five years are the ones that redesign their acquisition engine around the five levers above: AI-powered sales development, partner channel expansion, compounding organic investment, trial conversion optimization and NRR-driven expansion. Each lever compounds with the others. Together, they turn CAC from a quarterly pain into a structural advantage.
The difference between a 24-month CAC payback and a 12-month payback is the difference between perpetual capital-raising and self-funded growth. The difference between 2:1 LTV:CAC and 4:1 is the difference between burning cash and compounding it. The calculation framework, the benchmarks and the reduction levers in this guide are the operating system. Deploying them is the work.
Install the AI Operating System That Decouples Revenue From Headcount
peppereffect architects the autonomous acquisition engine that reduces blended CAC by 30–50% while accelerating deal velocity. AI-powered SDR orchestration, partner-channel activation, compounding content systems and trial-conversion optimization — deployed as an integrated 4 Pillars operating system, not piecemeal point solutions.
Book Your Growth Mapping CallExplore the 4 Pillars architecture → SEO economics and pricing marketing budget allocation framework
Resources
- First Page Sage — B2B SaaS Customer Acquisition Cost 2024 Report: Industry-vertical CAC data across fintech, medtech, HR tech, DevTools and database software segments.
- Benchmarkit — 2025 SaaS Performance Metrics: CAC ratio data showing median $2.00 per $1 new ARR and bottom-quartile $2.82.
- MetricKit — The Blended CAC Guide: Formula, segmentation and reporting patterns for operationally useful CAC.
- Optif — Fully-Loaded CAC Definition: Complete cost-inclusion methodology for PE-grade acquisition economics.
- SaaSHero — 2026 SaaS CAC Benchmarks: Stage-by-stage CAC ranges from pre-seed through enterprise.
- SaaSHero — B2B SaaS LTV:CAC Benchmarks: Elite and median ratio thresholds with payback period correlations.
- Phoenix Strategy Group — 2025 CAC Benchmarks by Channel: Per-channel median CAC from partner through outbound.
- Autobound — AI SDR Buying Guide 2026: Per-lead cost comparison ($39 AI vs. $262 human) and platform pricing tiers.
- T2D3 — The Great Recalibration: B2B SaaS Performance Metrics 2025: Structural shifts in SaaS unit economics and the hybrid GTM mandate.
- Prospeo — CAC Payback Benchmarks: Operational guidance on 12/18/24-month payback thresholds.
- Dan Siepen — Strategies to Improve SaaS CAC: Practical reduction tactics with channel-mix prescriptions.


