

What Is SaaS Growth Strategy at the $10M-$50M ARR Stage?
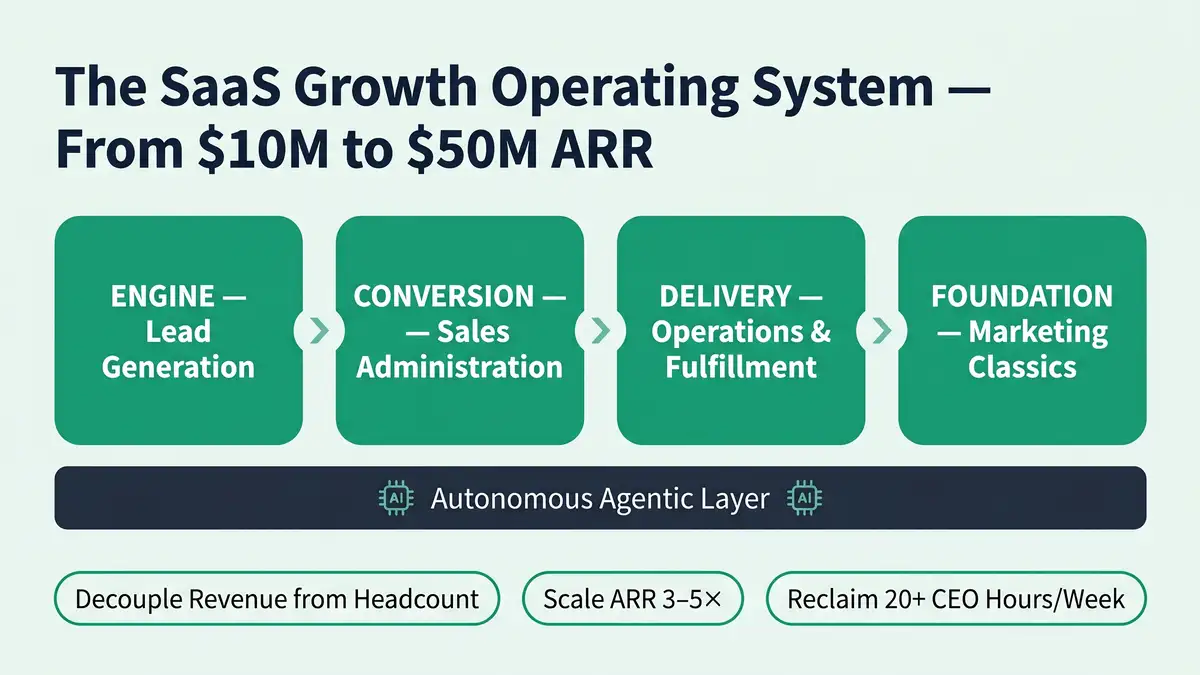
A SaaS growth strategy at the $10M-$50M ARR stage is an integrated operating system that decouples revenue expansion from linear headcount growth. It replaces the founder-led sales motion that got you to $10M with predictable, instrumented systems across four pillars: lead generation, sales conversion, customer fulfilment, and retention. At this stage, the constraint is no longer product-market fit — it is architecture. Companies that successfully cross the $50M ARR threshold install deterministic workflows, agentic automations, and benchmark-driven governance that compound efficiency as they scale.
The stakes are acute. Only 23% of B2B SaaS companies that reach $10M ARR cross $50M within ten years, and 42% plateau between $15M and $25M. The median mid-market SaaS company now takes 6.8 months to pay back customer acquisition cost, and CAC continues to climb as buyer committees expand and sales cycles lengthen. Growth strategy at this stage is not a marketing plan — it is a capital efficiency discipline executed through architecture.
What you'll learn in this playbook:
- Why 42% of B2B SaaS companies plateau between $15M and $25M ARR — and the structural causes you can eliminate
- The 2026 benchmarks that separate top-quartile operators from the median (Rule of 40, Magic Number, NRR, revenue per FTE)
- How to architect predictable lead generation without hiring a 30-person SDR team
- The sales operating system that converts pipeline as deal cycles lengthen to 150 days
- How agentic workflows decouple revenue growth from headcount at the $25M-$50M ARR threshold
- The retention architecture required to sustain NRR above 110% at scale
Key Takeaway
SaaS growth strategy at the $10M-$50M ARR stage is not about finding new channels. It is about installing an integrated operating system across lead generation, sales, fulfilment, and retention that compounds efficiency. The top quartile of mid-market SaaS runs on architecture. The median runs on headcount.
Why Do Most SaaS Companies Plateau Between $10M and $50M ARR?
The plateau is not a motivation problem. It is a growth deceleration built into the SaaS operating model. Natural decay in growth rates — driven by law-of-large-numbers dynamics, saturation in early-adopter segments, and the linear scaling of sales and success teams — pulls every company downward as ARR compounds. The companies that break through install systems that compensate for this decay.
Empirical data from 2025 B2B SaaS benchmarking reveals the pattern clearly. Mid-market companies that sustain 50% YoY growth at $10M typically decelerate to 35% YoY by $25M and 20% YoY by $50M ARR. Without architectural intervention, that deceleration stalls out entirely around $15M-$25M — the zone where 42% of B2B SaaS companies plateau.
| ARR Stage | Median YoY Growth | Top-Quartile YoY Growth | Primary Constraint |
| $10M ARR | 35-50% | 60-80% | Founder-led sales motion |
| $15M-$25M ARR (plateau zone) | 18-25% | 40-55% | Headcount-linked growth, CAC inflation |
| $25M-$40M ARR | 20-30% | 35-45% | Sales cycle elongation, buyer committees |
| $40M-$50M ARR | 15-22% | 28-38% | Retention economics, expansion velocity |
Sources: Lighter Capital 2025 B2B SaaS Benchmarks, Benchmarkit 2025 SaaS Operating Benchmarks
Three structural causes explain the plateau. First, headcount-linked growth: companies hire SDRs, AEs, CSMs, and engineers in lockstep with revenue, which erodes gross margin and depresses Rule of 40 performance. Second, CAC inflation: 67% of mid-market SaaS CEOs report rising customer acquisition cost as buying committees expand and outbound saturates. Third, operational fragmentation: marketing, sales, onboarding, and success run on disconnected tools with manual handoffs that absorb 30-40% of team capacity.

What Benchmarks Define SaaS Growth Strategy Success in 2026?
Benchmark-driven governance separates CEOs who architect growth from those who react to it. The 2026 operating benchmarks for $10M-$50M ARR B2B SaaS define clear top-quartile thresholds across four efficiency metrics: Rule of 40, Magic Number, CAC Payback, and Net Revenue Retention. The gap between median and top-quartile performance is not modest — it is typically 50% to 100% on each dimension.

Revenue per full-time employee is the quietest but most diagnostic metric. Top-quartile mid-market SaaS operators deliver $800,000 to $1.2M in ARR per FTE, while the median clusters at $400,000 to $600,000. That 50-100% efficiency gap is the direct product of architecture: top-quartile companies run agentic workflows, deterministic handoffs, and retention systems that eliminate the manual labour absorbing mid-pack teams. They do not work harder. They operate through better-engineered systems.
The Rule of 40 — the sum of growth rate plus EBITDA margin — has tightened considerably. In 2021, approximately 35% of mid-market SaaS exceeded 40. In 2026, that figure is 18% for private mid-market SaaS. The decline reflects both growth deceleration and margin compression from rising CAC. Companies that clear 40 consistently are the ones with installed operating systems across all four growth pillars.
| Metric | Median (2026) | Top Quartile (2026) | peppereffect Target |
| Rule of 40 | 22-28 | 45-60 | ≥ 45 |
| Net Revenue Retention | 108-112% | 118-130% | ≥ 115% |
| CAC Payback (months) | 18-24 | 9-12 | ≤ 12 |
| Magic Number | 0.6-0.8 | 1.0-1.3 | ≥ 1.0 |
| Revenue per FTE | $400K-$600K | $800K-$1.2M | ≥ $750K |
| Gross Margin | 72-76% | 80-85% | ≥ 78% |
Sources: Benchmarkit 2025, SaaS Capital Private SaaS Rule of 40, Driven Insights Rule of 40 Playbook
Review unit economics fundamentals before benchmarking — the ratios are only meaningful when the underlying contribution margin, churn cohorts, and expansion revenue are calculated consistently.
How Do You Architect Predictable Lead Generation Without Scaling Headcount?
Predictable pipeline is the first system to install — it is peppereffect's Engine pillar. At $10M ARR, most companies generate leads through founder networks, inbound SEO, and a small SDR team. None of those scale deterministically. The architecture that crosses $25M ARR combines three integrated channels: outbound cold email systems, LinkedIn outreach systems, and content systems (SEO, AEO, GEO) that build mental availability against the 95% of ICPs not yet in-market.
The ratio that matters is marketing spend as a percentage of ARR. 2026 SaaS marketing budget benchmarks indicate that mid-market companies in the $10M-$50M range allocate 35-50% of revenue to marketing and sales combined. Top-quartile operators do not spend more — they extract 2-3x the pipeline per dollar through integrated systems rather than siloed channels.
The architectural move is to treat each lead channel as a deterministic, instrumented workflow rather than a team responsibility. Cold email becomes a logic-gated system with ICP segmentation, trigger-based personalisation, and agentic reply handling. LinkedIn becomes a founder-voice thought leadership engine that outperforms brand pages 3:1 on engagement. Content becomes a multi-surface acquisition engine optimised for both traditional search and generative AI answer engines.
Key Takeaway
Pipeline predictability does not come from more SDRs. It comes from three integrated, instrumented channels running logic-gated workflows. Top-quartile operators deliver 2-3x the pipeline per marketing dollar by running channels as systems, not team responsibilities.
What Sales Operating System Converts Pipeline at $50M ARR Scale?
The sales environment at the $25M-$50M ARR threshold is measurably harder than it was three years ago. Median B2B SaaS sales cycles have lengthened from 90-120 days in 2022 to 120-150 days in 2024, and the average buying committee has grown from 4.2 stakeholders to 5.4. Deal velocity has declined, win rates have compressed, and proposal-to-close friction absorbs an increasing share of AE capacity.
The Conversion pillar answers this with three integrated systems: proposal generator systems that remove AE document-production time, lead nurture systems that maintain mental availability across 120-day cycles, and CRM automation systems that eliminate the 30% of AE hours currently consumed by data entry. Each is a deterministic workflow, not a team tool.
| Sales Metric | Pre-Architecture (Manual Ops) | Post-Architecture (Agentic Ops) | Velocity Lift |
| AE hours per deal | 38-52 | 22-32 | -35-40% |
| Proposal turnaround | 3-5 days | 3-8 hours | -80% |
| Time-to-first-response | 4-18 hours | 2-6 minutes | -95% |
| Sales cycle length | 120-150 days | 85-110 days | -25-28% |
| Win rate (qualified pipeline) | 18-24% | 22-30% | +12-18% |
Sources: Aggregated 2025-2026 benchmarks from Benchmarkit, HiBob CAC Payback Research
Running an AI-powered growth architecture is how top-quartile B2B SaaS compresses sales cycles and lifts Rule of 40 without scaling headcount.
Book a Growth Mapping CallWant to see your own CAC against peer benchmarks? Run the CAC Diagnostic for your true CAC, the 30 to 50% reduction agentic deployment delivers, and a board-ready PDF in 60 seconds.
Run the CAC DiagnosticHow Do Agentic Workflows Decouple Revenue from Headcount?
Agentic workflows — autonomous AI systems that execute multi-step tasks across the customer lifecycle — are the architectural mechanism that breaks the headcount-linked growth pattern. In 2026, 41% of mid-market B2B SaaS have deployed at least one AI sales tool, but only 18-22% have moved to true agentic pilots that eliminate labour rather than augment it. The performance gap is widening.
Installed agentic workflows reclaim 8-14 hours per week per AE and CSM, deliver 15-28% velocity lift across the pipeline, and produce 12-18% win rate uplift on qualified deals. The mechanism is not productivity theatre. It is the removal of specific manual tasks — CRM logging, proposal assembly, first-touch sequencing, renewal orchestration, onboarding journey execution — from human work queues into deterministic autonomous workflows.

The sequence for installing an agentic operating system at the $10M-$50M ARR stage is not complex, but it is strictly ordered. Each step presumes the prior step is complete. Most companies attempt agentic deployment out of sequence — they adopt proposal generators before CRM hygiene is in place, or deploy autonomous outbound before ICP segmentation is validated — and the systems fail to compound.
Install CRM Architecture & Data Hygiene
Deterministic pipeline stages, required-field governance, automated activity logging, and lead-scoring logic. Without clean CRM architecture, every downstream agentic workflow inherits noise.
Deploy Autonomous Lead Generation
Cold email, LinkedIn, and content engines running as integrated systems with ICP segmentation, trigger-based personalisation, and agentic reply handling. Pipeline predictability precedes conversion optimisation.
Install Sales Conversion Workflows
Agentic proposal generation, nurture sequences maintaining mental availability across 120-day cycles, and sales admin automation removing the 30% of AE time consumed by data entry.
Deploy Fulfilment & Onboarding Systems
Automated client onboarding, logic-gated fulfilment workflows, and project management automation. Delivery excellence is where churn is won or lost — install the architecture before scaling acquisition further.
Instrument Retention & Expansion
Health-score-driven expansion orchestration, renewal automation, and NRR instrumentation. The retention operating system is what converts $10M-$25M SaaS into $50M+ SaaS — not acquisition.
Avoid This Mistake
Do not adopt point-solution AI tools as a substitute for installed architecture. ChatGPT wrappers, sales-assist plugins, and single-feature automations deliver 2-5% productivity gains and do not compound. Agentic workflows deliver 25-40% efficiency lifts precisely because they are integrated across pipeline, conversion, and retention — not bolted onto existing manual processes.
What Retention Architecture Sustains NRR Above 110%?
Net Revenue Retention is the most economically consequential metric in SaaS growth strategy. A company growing at 25% YoY with 115% NRR compounds substantially faster — and requires proportionally less new acquisition — than a peer growing at 30% with 100% NRR. McKinsey research on NRR demonstrates that top-quartile B2B tech operators sustain 118-130% NRR through installed expansion architecture, while the median clusters at 108-112%.
The economics are decisive. Expansion CAC runs 15-25% of new-customer CAC, which means a dollar of expansion revenue is 4-6x more capital-efficient than a dollar of new ARR. Companies that install NRR-driving architecture — health-score-triggered expansion sequences, renewal automation, cross-sell workflows gated by usage patterns — shift the growth equation from acquisition-dependent to expansion-driven.
The architecture also solves the ARPU expansion problem. Top-quartile mid-market SaaS grow ARPU by 8-15% annually through deliberate seat expansion, usage-tier upgrades, and module attachment — not through price increases alone. The workflows are deterministic: usage signals trigger expansion plays; engagement declines trigger retention plays; renewal dates trigger upsell orchestration 90 days in advance.
Key Takeaway
NRR above 110% is an architecture outcome, not a CSM outcome. Top-quartile operators install expansion workflows that deliver dollars at 4-6x the capital efficiency of new acquisition. Companies that crack $50M ARR are almost always retention-driven before they are acquisition-driven.
How Do You Sequence the $10M to $50M ARR Operating System?
The four peppereffect pillars — Engine (lead generation), Conversion (sales), Delivery (fulfilment), Foundation (marketing classics) — compose a single integrated operating system, not a menu of services. CEOs at the $10M-$50M ARR stage who install this architecture deliberately, in sequence, produce Rule of 40 performance above 45 and NRR above 115% — the empirical signature of top-quartile operators. Those who pursue tactics piecemeal plateau in the $15M-$25M zone.
The sequence has a strategic logic. Retention architecture (Pillar 3) compounds every acquisition dollar, so it earns priority even when the organisational urgency feels like lead generation. Conversion workflows (Pillar 2) compound every pipeline dollar. Lead generation (Pillar 1) becomes efficient only when the downstream systems are engineered to convert and retain. Marketing classics (Pillar 4) — web architecture, search visibility, paid acquisition — scale what already works and should not precede installation of the other three.
Key Takeaway
SaaS growth strategy between $10M and $50M ARR is a sequenced architectural deployment, not a marketing programme. Retention compounds every acquisition dollar. Conversion compounds every pipeline dollar. Lead generation scales efficiently only when the downstream systems are built. CEOs who crack $50M ARR install the full operating system — they do not bolt tactics onto a broken foundation.
Frequently Asked Questions
What is the best SaaS growth strategy from $10M to $50M ARR?
The best SaaS growth strategy from $10M to $50M ARR is an integrated four-pillar operating system: predictable lead generation (Engine), deterministic sales conversion (Conversion), automated fulfilment (Delivery), and foundational marketing architecture (Foundation). Deployed in sequence, this architecture produces the empirical signature of top-quartile operators — Rule of 40 above 45, NRR above 115%, and revenue per FTE above $750K. Companies that plateau between $15M and $25M typically pursue tactics piecemeal rather than installing the system. Review the AI-powered SaaS playbook for implementation detail.
How fast should B2B SaaS grow at $10M-$50M ARR?
Median B2B SaaS at $10M ARR grows 35-50% YoY; top-quartile operators grow 60-80%. By $25M ARR, the medians compress to 18-25% YoY, and by $50M to 15-22%. Growth deceleration is structural — law-of-large-numbers dynamics, market saturation, and headcount-linked operating models pull every company downward. The companies that hold 30-40% YoY growth at $40M+ ARR are almost always running integrated operating systems with NRR above 115% and agentic sales workflows that compress cycles.
What is the Rule of 40 benchmark for mid-market SaaS in 2026?
In 2026, median private mid-market SaaS registers a Rule of 40 score of 22-28, and top-quartile operators register 45-60. Only about 18% of private mid-market SaaS exceed 40 — a notable decline from roughly 35% in 2021, driven by growth deceleration and CAC inflation. The redefined 2026 framework weights NRR and capital efficiency more heavily than simple growth-plus-margin arithmetic, reflecting how investors now assess SaaS quality.
Why do most SaaS companies plateau at $15M-$25M ARR?
Approximately 42% of B2B SaaS companies plateau between $15M and $25M ARR. Three structural causes drive the pattern. First, headcount-linked growth erodes gross margin as companies scale SDRs, AEs, CSMs, and engineers in lockstep with revenue. Second, CAC inflation compresses unit economics as buyer committees expand and outbound channels saturate. Third, operational fragmentation — disconnected tools, manual handoffs — absorbs 30-40% of team capacity. The plateau is an architecture problem, solvable by installing integrated systems across the four pillars.
How much should a $10M ARR SaaS spend on marketing?
Mid-market B2B SaaS in the $10M-$50M ARR range typically allocate 35-50% of revenue to combined sales and marketing. Top-quartile operators do not spend more than the median — they extract 2-3x the pipeline per dollar through integrated, instrumented channels rather than siloed teams. 2026 budget allocation research indicates marketing-specific spend of 12-18% of ARR for sustained growth, with the balance in sales capacity. The efficiency differential is architecture, not budget.
What NRR is required to reach $50M ARR from $10M?
Net Revenue Retention of 115-120% is the empirical threshold that separates companies which reach $50M ARR from those that plateau. At 100% NRR, every dollar of growth requires a new-acquisition dollar; at 115% NRR, the retained base generates meaningful compounding growth independently. Expansion CAC runs 15-25% of new-customer CAC, making retention-driven growth 4-6x more capital-efficient. Companies crossing $50M ARR are almost always retention-driven before they are acquisition-driven. See the NRR playbook for the full architecture.
How does agentic AI change SaaS growth strategy at scale?
Agentic AI workflows decouple revenue growth from headcount — the central architectural problem between $15M and $25M ARR. Installed agentic systems reclaim 8-14 hours per week per AE and CSM, deliver 15-28% sales velocity lift, and produce 12-18% win rate uplift on qualified deals. Only 18-22% of mid-market SaaS have moved beyond point-solution AI tools to integrated agentic pipelines. The efficiency gap between operators running installed agentic architecture and those using ChatGPT wrappers is widening at roughly 10-15 percentage points of Rule of 40 per year.
Install Your $10M-$50M ARR Growth Operating System
peppereffect architects integrated growth operating systems for mid-market B2B SaaS companies. We deploy the four-pillar architecture — Engine, Conversion, Delivery, Foundation — that produces Rule of 40 above 45 and NRR above 115% without scaling headcount.
Book Your Growth Mapping CallExplore the 4 Pillars Architecture → B2B content strategy that drives pipeline SEO for B2B SaaS companies Generative Engine Optimization for SaaS SaaS go-to-market strategy SaaS raise vs bootstrap framework SaaS marketing budget benchmark
Resources
- Benchmarkit 2025 SaaS Operating Benchmarks — Revenue per FTE, Rule of 40, and cohort efficiency metrics
- Lighter Capital 2025 B2B SaaS Startup Benchmarks — Growth deceleration patterns by ARR stage
- Ordway Labs — Rule of 40 definition, calculation, and benchmarking
- Abacum — Rule of 40 Redefined Framework for 2026 SaaS Finance
- SaaS Capital — Growth, Profitability, and Rule of 40 for Private SaaS
- McKinsey — The Net Revenue Retention Advantage in B2B Tech
- Proven SaaS — CAC Payback Benchmarks by ARR Stage
- GrowthSpree — SaaS Marketing Budget Allocation by ARR Stage, 2026


