

Net Dollar Retention is now the board's primary valve. Median B2B SaaS NDR sits at 100–101%, but the public companies trading at 10–12x revenue multiples disclose 120%+ NDR; the ones at 4–6x sit at 95–105%. Between those two cohorts is a 30–50% valuation premium engineered entirely from existing customers. Snowflake reports 125% for FY2026, Datadog ~120% for trailing twelve months at Q4 2025, Cloudflare 120% in Q4 2025 — and HubSpot, having dragged itself from 88.6% at IPO to 105% by the close of 2025, demonstrates the only thing that matters for a $10M–$40M ARR CEO: a moveable metric.
This playbook gives you the architecture to move NDR from 90% to 130%+ in 12 months. The formula precision (NDR vs NRR vs GDR), the 2024–2026 benchmarks by ACV cohort, the six expansion levers, the quarter-by-quarter deployment, and the failure modes that pin most companies at 100–105%. Built for operators who refuse to confuse "stable retention" with the structural problem it actually is.
Why NDR Has Become the Board's Primary Valve

In 2026, NDR has displaced ARR growth, CAC, and even LTV:CAC as the single most-watched SaaS metric for boards and investors. The reason is mechanical: NDR is the only metric that correlates cleanly across private and public financials, signals product stickiness without confounding new-logo growth, and translates directly into valuation multiples. Public SaaS comps in the 10–12x revenue range routinely disclose NDR above 120%; comps stuck at 4–6x cluster between 95% and 105% (SaaStr — What's a Good Net Retention Rate in SaaS).
The board-level math is unforgiving. Increasing NDR from the 90–100% band to the 100–110% band lifts growth rate by roughly 9 percentage points without adding a single sales rep, and companies with the highest NDR report median growth at 2x the population median (SaaS Capital — High-NRR Startups Grow Twice as Fast). If you reach 120% NDR, your existing customer base alone doubles your ARR in under five years — even if you stop acquiring new logos entirely. Above 130%, the compounding becomes the dominant story your board tells your future investors. The metric is the cleanest single readout of whether your SaaS unit economics are compounding or eroding.
The Board Mandate
For a $10M–$40M ARR CEO, the explicit mandate from a Series B/C/D board in 2026 is: move NDR from "defensive" (95–105%) into "competitive" (110–115%) within 18 months and ideally "elite" (130%+) within 36 months. Founder equity vesting, CFO compensation, and executive bonus pools are increasingly tied to NDR threshold gates of 105%, 115%, and 130%.
NDR vs NRR vs GDR: The Formula Precision Most Companies Get Wrong
The first failure mode is technical: most mid-market SaaS companies report a number called "NRR" while doing the math for "NDR" — or worse, mix new-logo ARR into a denominator that should not include it. The board sees a number; the metric is wrong by 3–7 points; the trajectory looks healthier than reality.
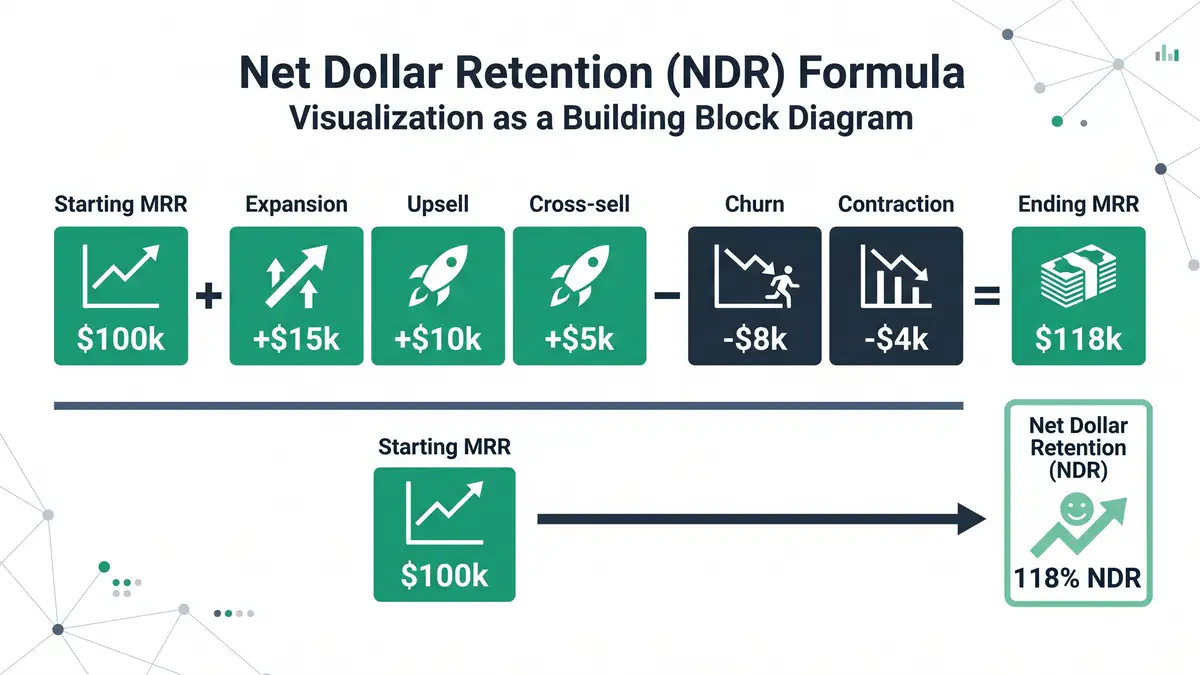
Net Dollar Retention (NDR): the precise formula tracks ARR change for a fixed cohort of customers active at period start, with no new logos in either numerator or denominator.
NDR % = (Beginning ARR + Expansion + Upgrades + Cross-sell + Price Increases − Churn − Downgrades) ÷ Beginning ARR × 100
| Metric | What it includes | What it excludes | Typical range |
| NDR (Net Dollar Retention) | Existing-cohort ARR + expansion − churn/contraction | New-logo ARR (numerator AND denominator) | 85-160% |
| NRR (Net Revenue Retention) | Often used synonymously with NDR; some frameworks add new-logo ARR to numerator | Varies by company; check 10-K methodology | 85-160% |
| GDR (Gross Dollar Retention) | Beginning ARR − churn − downgrades only | All expansion (caps at 100%) | 85-95% |
Sources: ChartMogul NRR methodology, ChartMogul Gross vs Net Retention, CFI NDR Formula, Ordway Labs Public SaaS NRR Methodology Report.
ChartMogul, like most modern subscription-analytics platforms, treats NDR and NRR as synonymous when calculated cleanly: the metric measures retention plus expansion of an existing customer cohort. Where they diverge is in 10-K disclosure variance. Snowflake, Datadog, and Cloudflare all disclose "Net Revenue Retention" on the cohort-only basis (effectively NDR). HubSpot historically reported on a slightly broader basis. If you are reporting to an investor board, get this right before you lose the credibility argument: see your Net Revenue Retention reference for cohort methodology and your expansion revenue strategy for what fills the numerator.
Want to know exactly which of these levers would reclaim the most hours in your business? Take the 4-minute Technician's Trap Scorecard.
Get My Personalised ReportWant to see your own CAC against peer benchmarks? Run the CAC Diagnostic for your true CAC, the 30 to 50% reduction agentic deployment delivers, and a board-ready PDF in 60 seconds.
Run the CAC Diagnostic2024–2026 NDR Benchmarks: Public, Private, by ACV
NDR is not randomly distributed. It correlates deterministically with Average Contract Value (ACV) and customer-segment economics. The benchmark to compare yourself against is your ACV cohort — not the broad SaaS median.
| ACV Segment | Median NDR | Top-Quartile NDR | Annual Logo Churn |
| Enterprise ($250K+) | 125% | 140%+ | 8-12% |
| Upper Mid-Market ($100K-$250K) | 118% | 130% | 10-15% |
| Mid-Market ($10K-$100K) | 108% | 115% | 12-18% |
| Lower Mid-Market ($5K-$10K) | 103% | 108% | 15-22% |
| SMB (<$5K) | 92% | 100% | 20-35% |
Sources: Benchmarkit 2025 SaaS Performance Metrics, G-Squared CFO 2025 SaaS Benchmarks, Bessemer Cloud 100 Benchmarks Report, ChartMogul SaaS Retention Report.
The implication for a $10M–$40M ARR mid-market company is direct. If your median ACV is $30K and your NDR is 95%, you are tracking 13 points below your natural cohort median of 108% — a structural architecture problem, not a market saturation story. If you are at 105%, you are still 10 points below the top quartile of your cohort. The benchmark to chase is set by ACV, not by aspiration.
Public SaaS NDR Disclosures (2025–2026)
| Company | NDR | Period | Filing / Source |
| Snowflake | 125% | FY2026 (Jan 2026) | SEC 10-K |
| Datadog | ~120% TTM | Q4 2025 | Earnings call |
| Cloudflare | 120% | Q4 2025 | Earnings call |
| HubSpot | 105% | Q4 2025 | Earnings call |
Sources: Snowflake FY2026 Q1 Press Release, Datadog Q4 2025 Earnings, Cloudflare Q4 2025 Earnings, HubSpot Q4 2025 Earnings, SaaStr — HubSpot NRR History 88.6% to 115%.
HubSpot's trajectory is the most instructive for mid-market operators. From 88.6% at IPO, to a 115% peak, back down to 102% during the post-pandemic compression, and now climbing again to 105% on the back of seat-based pricing redesign, modular cross-sell, and renewal-pricing increases. NDR is moveable in either direction — and the moves are architectural, not heroic.
The Six Levers of NDR Expansion

Every basis point of NDR uplift flows through one of six levers. The companies that move from 90% to 130%+ deploy all six concurrently — not sequentially, not selectively. Skip any lever and you cap the metric.
Churn Prevention (the floor)
NDR cannot exceed Gross Dollar Retention plus expansion. If GDR is 85%, you need 45 points of expansion to hit 130%. Drop logo churn 4–6 points through health-score early warning, automated dunning recovery, and CSM intervention sequences before any expansion lever moves the needle. Median 2025 logo churn is 12–18% mid-market; top quartile is sub-10%.
Seat & Usage Expansion (the easiest)
Per-seat license growth as customers add users; usage growth as consumption increases. Mechanically simple but exposed to AI-era seat compression. The most reliable expansion vector at $10K–$100K ACV — and the single largest input to MRR optimisation. Seat-based pricing was the largest single contributor to HubSpot's NDR climb in 2025 (HubSpot Q4 2025 earnings).
Tier & Edition Upgrade
Customers move Starter → Growth → Enterprise as use cases mature. Compounds at 8–15% of base ARR annually when feature gating maps to genuine value milestones. Corrosive when feature gating reflects what the product team built rather than what the customer values.
Cross-Sell & Module Adoption
Customer adopts adjacent product lines or modules. Highest-LTV lever at scale. 62% of HubSpot's new Pro+ customers landed with multiple Hubs in 2025 — engineered cross-sell from day one rather than retrofitted later (HubSpot Q4 2025).
Price Optimisation
Annual list-price increases of 3–7% (or aggressive 8–12% for AI-bundled tiers). HubSpot drove up to a 5% renewal-pricing increase in 2025 as customers migrated; this single lever delivered roughly 2–3 points of NDR uplift on its own. The cleanest lever you have, executed quarterly with grandfathering rules to protect retention. Your B2B pricing strategy determines how much headroom you have here.
Multi-Year Contract Restructuring
Multi-year contracts with built-in escalators and credit-roll mechanics smooth NDR volatility and lock in expansion. Annual one-year renewals concentrate expansion risk into a single negotiation; multi-year contracts spread it across the term and make NDR forecastable 18–24 months out.
Architecture Decision
The six levers compound multiplicatively, not additively. A company that runs all six even modestly (1–2 points of NDR each) lifts NDR by 8–14 points. A company that runs only seat-expansion plus tier-upgrade is structurally capped near 110–115%. There is no path to 130% without all six.
Diagnose which of the six NDR levers your company has installed — and which are missing.
Book a Growth Mapping CallThe 12-Month NDR Deployment Roadmap

The deployment sequence matters. Health-score infrastructure before playbook design. Playbook before automation. Automation before sales enablement. Companies that try to skip phases produce expensive dashboards nobody acts on, and 12 months later their NDR has not moved.
| Quarter | Focus | Outcome | NDR Trajectory |
| Q1 (Days 1–90) | Diagnose & instrument: NDR baseline by cohort, GDR audit, health-score model deployed, churn-prevention playbooks live | Logo churn -2-4 points; data quality verified | 90% → 95-97% |
| Q2 (Days 91–180) | Expansion levers 1-3: seat/usage automation, tier-upgrade playbooks, churn-prevention agentic monitoring | Expansion ARR up 25-40% YoY pace | 95-97% → 105-110% |
| Q3 (Days 181–270) | Expansion levers 4-6: cross-sell sequencing, annual price increase rollout, multi-year contract restructuring | Cross-sell adoption +30-50%; multi-year contract mix to 40%+ | 105-110% → 115-120% |
| Q4 (Days 271–365) | Optimise & compound: agentic AI orchestration across all 6 levers, CSM/AM compensation alignment, board-grade reporting | NDR forecasting 85%+ accuracy 60 days out | 115-120% → 125-130%+ |
Sources: Benchmarkit 2025, ChartMogul Retention Report, SaaStr Playbook to Boosting Net Retention.
The 90% → 130% trajectory is not optimistic. It is what disciplined execution looks like when leadership commits to NDR as architecture rather than aspiration. The CFO's job is to validate the math; the COO's job is to install the infrastructure; the CEO's job is to refuse to confuse "stable retention" with the structural problem it actually represents at this stage.
Five Failure Modes That Pin NDR at 100–105%
Failure 1 — Reporting NDR with the Wrong Denominator
Mixing new-logo ARR into the NDR denominator inflates the number 3–7 points and conflates retention with acquisition. The board reads the number as expansion success when it is actually new-logo growth. Trust collapses when the discrepancy surfaces in due diligence.
Failure 2 — Treating GDR as a Retention Floor Rather Than a Defect Rate
If Gross Dollar Retention is 85%, NDR is mechanically capped at GDR + expansion delta. A 4-point churn reduction (from 15% to 11% annual) lifts your GDR ceiling and gives you 4 NDR points before any expansion lever fires. Most companies optimise expansion before fixing the leak.
Failure 3 — Annual-Cycle Expansion Trapped at Renewal
Expansion only at renewal time means 11 months of foregone revenue and a high-stakes negotiation that risks both expansion and renewal. Continuous expansion driven by health-score signals decouples expansion from renewal pressure and compounds throughout the year.
Failure 4 — CSM Compensation Tied to Retention Only
If the CSM is paid only on logo retention, the role becomes risk-averse account stewardship. Variable comp tied to expansion ARR (after the playbook infrastructure exists) flips the role from defender to growth driver. Single biggest soft-lever fix in mid-market SaaS.
Failure 5 — Pure-Seat Pricing in the AI-Agent Era
Per-seat licenses are structurally exposed as customers replace human seats with AI agents. Hybrid pricing that blends subscription + usage + outcome-based components delivers measurably higher NDR (the OpenView/High Alpha data set repeatedly shows hybrid pricing models materially outperform pure-seat on NDR). If your pricing model is pure-seat, your 130% ceiling is structural, not effort-bound.
Agentic AI as the NDR Multiplier

The expansion architecture has become an AI orchestration problem, not a CSM staffing problem. Agentic AI compresses the time between signal detection and playbook activation from weeks (manual CSM review cadence) to seconds (autonomous trigger), and lifts the ceiling on every one of the six levers simultaneously. Specific 2026 deployments are documenting 30%+ higher expansion conversion from AI-prioritised outreach, 40–60% reduction in CSM administrative load, and 85%+ accuracy in 60-day NDR forecasting.
The orchestration deploys at four agent roles: (1) signal-detection agent ingesting product usage, support tickets, payment events, CRM activity, and external signals into a continuously-updated customer health score; (2) playbook-routing agent that fires the right sequence (tier-upgrade, seat-expansion, cross-sell, churn-prevention, win-back) when thresholds trip; (3) execution agent drafting personalized outreach, booking QBRs, generating expansion proposals, and updating CRM stages; (4) forecasting agent rolling expansion-pipeline data into board-grade NDR forecasts and running continuous what-if scenarios. peppereffect installs this layer across the four-pillar architecture — the connective tissue is your Customer Success automation stack, your agentic workflow orchestration, and your CRM automation spine.
Bottom Line
Net Dollar Retention is not a measurement. It is the engineered output of an architecture. The six levers (churn prevention, seat/usage, tier upgrade, cross-sell, price, multi-year) deployed on a health-score signal layer with agentic AI orchestration is the system. The 12-month roadmap is the install. The 30–50% valuation premium that 120%+ NDR generates is the financial outcome. The CEO's job is not to wait for NDR to drift back up. It is to install the operating system that compounds NDR faster than the market re-rates. Companies that miss this transition will plateau between 100% and 110% NDR with eroding multiples. Companies that complete it will compound to 130%+ on the same headcount.
Install the NDR Operating System
peppereffect architects the six-lever NDR infrastructure — health-score signal layer, agentic AI orchestration, expansion playbook automation — for $10M–$40M ARR B2B SaaS CEOs ready to lift NDR from 90-105% to 120-130%+ in 12 months without scaling headcount. Diagnostic call. Architectural blueprint. Quarterly deployment.
Book Your Growth Mapping CallSee the Expansion Revenue Architecture →
Frequently Asked Questions
What is Net Dollar Retention (NDR)?
NDR is the percentage of recurring revenue retained from an existing customer cohort over a defined period (typically 12 months), including expansion, upsell, cross-sell, and price changes minus churn and downgrades, divided by the cohort's beginning ARR. New-logo ARR closed in the period is excluded from both numerator and denominator. NDR is the primary metric SaaS boards use to grade product stickiness and capital-efficient growth.
What's a good Net Dollar Retention rate for B2B SaaS?
The 2025 median is 100–101%. Top performers sit at 111%+ and elite operators reach 120–140%. Benchmark by ACV: enterprise (>$250K ACV) median is 125%; mid-market ($10K–$100K ACV) median is 108%; SMB (<$5K ACV) median is 92%. A $10M–$40M ARR mid-market company should target 110% as the floor and 120% as the operating ambition.
What is the difference between NDR and NRR?
Most modern SaaS analytics platforms (ChartMogul, Paddle, Klipfolio) treat NDR and NRR as synonyms when calculated cleanly: both measure existing-cohort retention plus expansion. Where they diverge is in 10-K disclosure: some companies historically included new-logo ARR in NRR's numerator, inflating the metric 3–7 points. Always verify methodology before trusting the headline number.
How is Net Dollar Retention calculated?
NDR % = (Beginning Period ARR + Expansion + Upgrades + Cross-sell + Price Increases − Churn − Downgrades) ÷ Beginning Period ARR × 100. The denominator includes only customers active at period start; new logos in the period are excluded. Reported quarterly by most public SaaS, monthly by sophisticated mid-market companies for granular cohort tracking.
What's the difference between NDR and Gross Dollar Retention (GDR)?
GDR captures only churn and downgrades from the existing cohort; it cannot exceed 100%. NDR adds expansion, upsell, cross-sell, and price increases, and can exceed 100% (up to 160% in elite cases). Reading both metrics together: GDR diagnoses your churn problem; NDR diagnoses your expansion architecture.
Can a SaaS company achieve 130% NDR in 12 months from 90%?
Yes — but only with concurrent execution on all six expansion levers and disciplined health-score infrastructure. Q1 fixes churn (90% → 95-97%), Q2 deploys seat/tier expansion (97% → 105-110%), Q3 layers cross-sell + price + multi-year (110% → 115-120%), Q4 compounds via agentic orchestration (120% → 125-130%+). Companies running only one or two levers cap at 110–115%.
Does Net Dollar Retention include new customers?
No. NDR specifically measures retention and expansion of an existing customer cohort. New-logo ARR closed during the measurement period is excluded entirely from both numerator and denominator. This is what distinguishes NDR from "total ARR growth" — it isolates the health and economic value of existing customers from acquisition velocity.
Resources
- Benchmarkit — 2025 SaaS Performance Metrics
- Bessemer Venture Partners — Cloud 100 Benchmarks Report
- G-Squared CFO — SaaS Benchmarks 2025
- High Alpha — 2025 SaaS Benchmarks Report
- ChartMogul — Net Revenue Retention Methodology
- ChartMogul — Gross vs Net Retention Guide
- ChartMogul — SaaS Retention Report
- Snowflake — FY2026 Financial Results
- Datadog — Q4 2025 Earnings Call Transcript
- Cloudflare — Q4 2025 Earnings Call Transcript
- HubSpot — Q4 2025 Earnings Call Transcript
- SaaStr — HubSpot NRR Trajectory History
- SaaStr — What's a Good Net Retention Rate
- SaaStr — SaaS Capital High-NRR Growth Study
- SaaStr — Playbook to Boosting Net Retention
- Corporate Finance Institute — NDR Definition & Calculation
- Orb Billing — Net Dollar Retention Strategies
- Ordway Labs — Public SaaS NRR Reporting Methods


