The quarterly SaaS board deck is the highest-leverage document the CEO produces all year. Two hours of board time. Three to five investor directors who read 30 to 50 of these per quarter. One narrative arc that either earns trust or burns it. The 2026 environment has tightened the bar: median private B2B SaaS growth has decelerated to 26%, a nine-point gap below the historical 35% target, and investors now scan the operating scoreboard in 30 seconds before forming a quarterly verdict on the company. Vanity metrics no longer survive that scan.
This article installs the canonical 2026 SaaS board deck template for $10M to $40M ARR founders. It covers the 14-slide narrative arc, the 12-metric operating dashboard, the retention waterfall, the Rule of 40 / Burn Multiple / Magic Number trio, the tough-news slide, the asks slide, the seven anti-patterns that frustrate investors, and the 30/14/7/2/0-day prep cadence. It pairs with the underlying SaaS financial model and the weekly CEO dashboard.
Strategic intent
A great board deck is a thinking document. It says what changed, what you concluded, and what you will do next, with the metrics as evidence rather than the main act. Build it once, refine the cadence forever.
The 14-Slide Canonical Structure
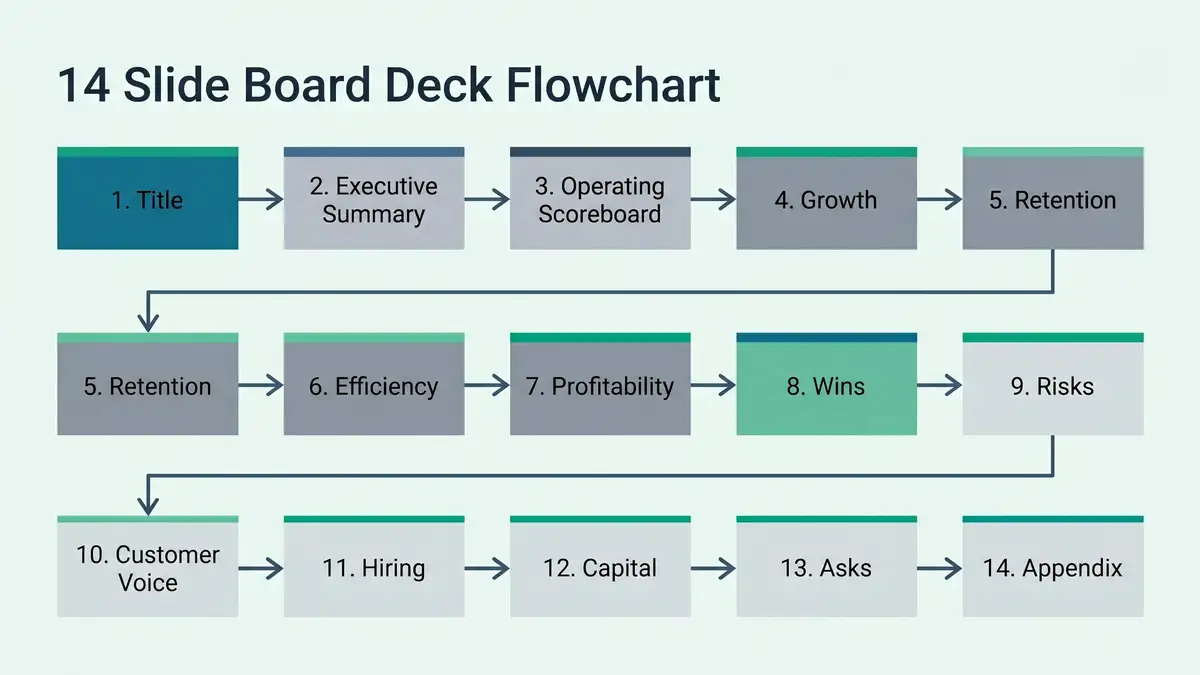
The 2026 consensus SaaS board deck, drawn from Sequoia board prep guidance, Bessemer's six-minute board meeting, David Sacks' operating cadence, and SaaStr's template, runs 14 to 18 slides with an appendix. Each slide has a single job. If a slide tries to do two things, it becomes a slide that does neither.
| Slide | Title | Job of the slide |
| 1 | Title | Quarter, period covered, names of attendees, date the deck was distributed. |
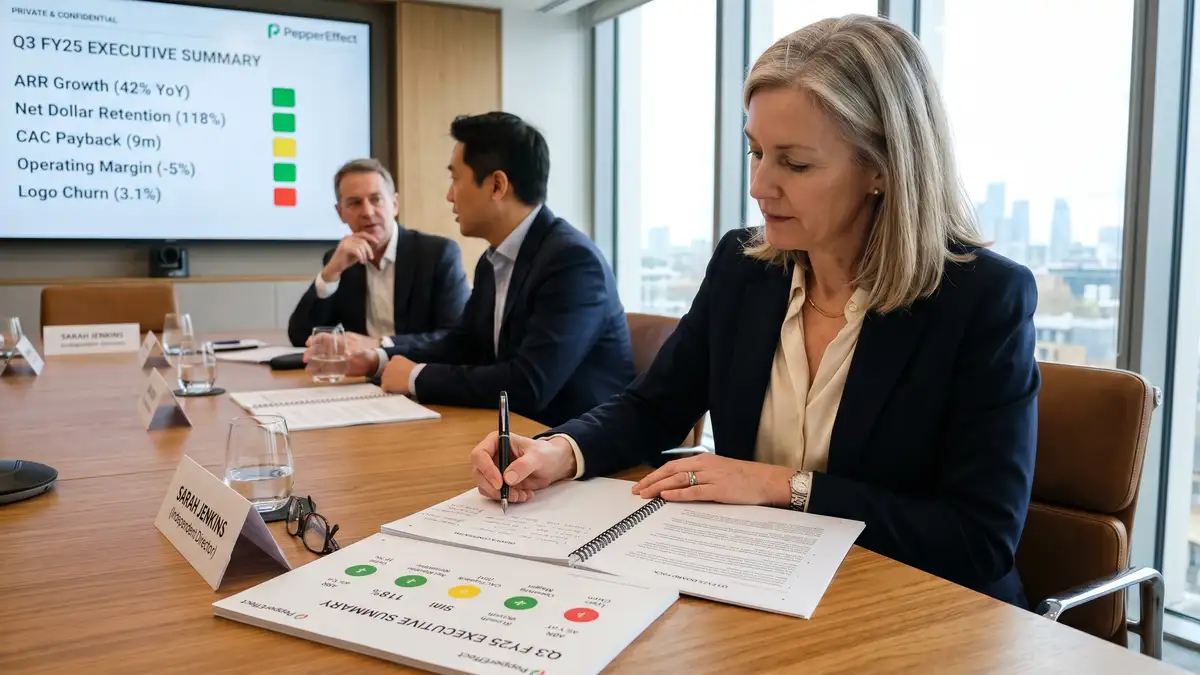
| 2 | Executive Summary | One slide. Three bullets: what went well, what missed, what we are doing about it. Plus a traffic-light status on the four operating quadrants. |
| 3 | Operating Scoreboard | The 12-metric dashboard. Growth, Retention, Efficiency, Profitability. Current quarter, prior quarter, plan, year ago. |
| 4 | Growth Deep Dive | New ARR, ARR growth rate, pipeline coverage, win rate trend. One chart that drives the conversation. |
| 5 | Retention Deep Dive | NRR / GRR waterfall, churn analysis, expansion split. Cohort cohesion chart if material. |
| 6 | Efficiency Deep Dive | CAC payback, Net Burn Multiple, Magic Number, Revenue per Employee. The unit-economics quadrant. |
| 7 | Profitability and Runway | Gross margin, Rule of 40, cash position, runway in months, scenario sensitivities. |
| 8 | Strategic Wins | 2 to 4 named wins. Logos, expansions, hires, product launches, partnerships. With dollar impact where applicable. |
| 9 | Strategic Risks | The 2 to 3 things that could materially move the next two quarters. Stated bluntly. Each with current mitigation. |
| 10 | Customer Voice | 3 to 5 verbatim customer quotes. Including at least one churn quote. NPS or CSAT trend if relevant. |
| 11 | Hiring Plan | Open roles, fill timing, headcount plan vs plan, fully loaded burn impact. |
| 12 | Capital Plan | Burn, runway, next round timing, hybrid instruments. Tie to the raise-vs-bootstrap framework and the broader SaaS GTM strategy. |
| 13 | Asks and Decisions | Specific board-input items. Hiring approvals, intros required, decisions needed at this meeting. |
| 14 | Appendix | Detailed financials, cohort tables, win-loss breakdown, customer success data, prior-quarter commitments status. |
Source: synthesis of Sequoia, Bessemer, David Sacks Craft Ventures, Lenny Rachitsky, Serena Capital.
The 12-Metric Operating Scoreboard
Slide 3 is the centrepiece. Investors read this slide first, sometimes only. The 12-metric scoreboard maps directly to the SaaS CEO Dashboard framework: four quadrants, three metrics each, current quarter compared against plan, prior quarter, and year ago. Format matters. Bigger numbers, smaller charts, traffic-light colour coding on each metric versus plan.
| Quadrant | Metric | 2026 mid-market benchmark | Top quartile |
| Growth | New ARR (quarterly) | vs plan ±10% | 10%+ over plan |
| Growth | ARR Growth Rate (YoY) | 26% median | 50%+ top quartile |
| Growth | Pipeline Coverage | 3x healthy | 4x top quartile |
| Retention | NRR | 110% healthy | 120%+ top quartile |
| Retention | GRR | 90%+ healthy | 95%+ top quartile |
| Retention | Logo Churn Rate | under 1%/month | under 0.5%/month |
| Efficiency | CAC Payback | 14-22 months | under 14 months |
| Efficiency | Net Burn Multiple | 1.0-2.0x | under 1.0x |
| Efficiency | Revenue per Employee | $200-280K | $300K+ |
| Profitability | Gross Margin | 75-80% | 80%+ |
| Profitability | Rule of 40 | 40-60 | 60+ |
| Profitability | Cash Runway | 18+ months | 24+ months |
Source: Bessemer Atlas 2026, ICONIQ 2025 State of GTM, Benchmarkit 2026.
What Investors Actually Scan in 30 Seconds

Sequoia partners reading 30 to 50 board decks per quarter develop a scanning pattern. Lenny Rachitsky's 2026 analysis of dozens of board-member interviews surfaces a consistent five-element scan: Rule of 40 number, NRR number, cash runway in months, the executive-summary traffic lights, and the asks slide. Everything else gets a deeper read only if those five raise a question.
The five fastest ways to lose investor trust in the first 30 seconds:
Five board-deck anti-patterns that trigger investor friction
(1) Missing or buried Rule of 40 / Burn Multiple / NRR. (2) New definitions of old metrics quarter to quarter. (3) Vanity metrics (MAU, "engagement") presented as KPIs. (4) Blame-shifting language ("the market was challenging"). (5) Deck distributed less than 24 hours before the meeting.
Want to see your own CAC against peer benchmarks? Run the CAC Diagnostic for your true CAC, the 30 to 50% reduction agentic deployment delivers, and a board-ready PDF in 60 seconds.
Run the CAC DiagnosticThe Rule of 40 / Burn Multiple / Magic Number Trio
These three valuation predictors belong on the operating scoreboard and again on the Profitability deep dive. Aventis Advisors 2026 documents a 74% EV/Revenue valuation premium for Rule of 40 winners (4.8x median multiple) versus non-winners (2.7x). Bessemer's 2026 Cloud Atlas identifies Burn Multiple as the single highest-correlation valuation predictor post-2024.
| Metric | Formula | 2026 healthy band | Board-slide presentation |
| Rule of 40 | ARR Growth % + EBITDA Margin % | 40-60 healthy, 60+ top quartile | Single number with 8-quarter trend line |
| Net Burn Multiple | Net Burn ÷ Net New ARR | under 1.0 excellent, 1.0-2.0 healthy | Quarterly bar chart with target line at 1.5x |
| Magic Number | (Net New ARR × 4) ÷ Prior Q S&M Spend | 0.75-1.0 healthy, 1.0+ top quartile | Last 4 quarters with sales-channel attribution |
Source: Wall Street Prep Rule of 40, BCG 2025, Aventis Advisors 2026.
The Retention Waterfall
The NRR / GRR waterfall is the highest-information slide in the deck. It tells the board, in one visual, whether the bucket leaks faster than it fills. Scale Venture Partners' ARR waterfall framework remains the industry-standard structure.
Start: opening ARR
ARR at start of period. State explicitly which date and currency.
Subtract: gross churn
Logo churn + downsell ARR. This is the negative bar. Split logo churn vs downsell visually if the two have different drivers.
Add: expansion ARR
Upsell + cross-sell + price expansion. Positive bar. Healthy B2B customer retention shows expansion exceeding gross churn by 10 to 30 percentage points.
Add: new ARR
New-logo bookings landed in the period. Separate slide if material; on the waterfall, show as the final positive bar.
End: closing ARR + NRR / GRR labels
Closing ARR. NRR % calculated from existing-customer movements only. GRR % showing gross retention before expansion. Label both clearly so the board does not need to ask.
The Tough News Slide: How the Best CEOs Handle Misses
Every quarterly deck contains a miss eventually. The difference between CEOs who keep board trust and those who lose it is the structure of the tough-news slide. David Sacks' operating cadence and SaaStr's board template converge on a four-part structure.
Problem stated cleanly in one sentence
"Q3 New ARR landed at 78% of plan, missing the $4.2M target by $920K." No hedging, no caveat-first framing.
Diagnosis with named drivers
2-3 specific drivers, not vague categories. "60% of the gap traces to a delayed product launch in Region X; 25% to slower sales cycles in Enterprise (95 days vs 72 plan); 15% to a single enterprise deal that slipped into Q4."
Response actions already taken
Specific actions, with dates. "Launched the delayed product on October 12. Hired enterprise AE to compress the 95-day cycle. Q4 starts with $4.8M in qualified pipeline against $4.0M target."
Forward plan with named owner and date
"By Q1 board meeting, we will have closed the slipped enterprise deal and the new AE will have completed ramp. I personally own the recovery; here are the three metrics I will report against next quarter."
Want a 14-slide board deck template plus the 12-metric scoreboard pre-wired to your CRM and finance stack so the next quarterly meeting earns trust instead of burning it?
Book a Freedom Machine DiagnosticThe Asks Slide That Actually Gets Help
Most boards underuse their directors. The asks slide is how the CEO converts board members from passive reviewers into active accelerators. Each ask follows a four-field structure: ask, expected outcome, owner, deadline.
| Ask type | Example | What good looks like |
| Customer introduction | "Intros to 5 procurement leaders at $500M+ healthcare companies" | Named target accounts, target buyer title, 2-week deadline |
| Talent introduction | "VP Marketing candidate referrals with PLG to enterprise experience" | Specific role spec attached as appendix, deadline aligned to hiring plan |
| Strategic decision | "Approve $1.2M expansion into DACH region in Q4" | Decision criteria, risks named, alternative options, vote at meeting |
| Capital decision | "Authorise $5M venture-debt facility with SVB" | Term sheet attached, comparable terms benchmarked, vote at meeting |
| Founder support | "Two hours of CRO time with [board member name] to review GTM motion" | Specific time commitment, named individual, calendar invite within 7 days |
Source: OpenView Founder's Guide to Board Meetings, SaaStr board template.
The 30/14/7/2/0 Day Prep Cadence
The best board decks are not built in the 48 hours before the meeting. They are built in a documented cadence that starts 30 days out. Borrowed from Sacks' operating cadence and refined at $10M to $40M ARR scale.
| Day | Owner | Action |
| T-30 | CEO + CFO | Quarterly close kicked off. Operating scoreboard data freeze date confirmed. Strategic narrative angle agreed in writing. |
| T-14 | CFO | Operating scoreboard populated. Variances to plan flagged. NRR/GRR waterfall built. |
| T-7 | CEO | Tough-news slides drafted. Asks slide drafted with specific owners and deadlines. CEO does first dry run with CFO and chief of staff. |
| T-2 | CEO | Deck distributed to board with one-paragraph pre-read summary. Pre-call requested with lead director if a major miss is on the agenda. |
| T-0 | CEO | Meeting. Async portion (executive summary + operating scoreboard) covered in 10 minutes max. Discussion focused on strategic risks, asks, and decisions. |
| T+1 | Chief of staff | Action items, AI-generated meeting summary, and updated KPI tracker distributed within 24 hours. |
Source: David Sacks Craft Ventures, OpenView, Sequoia.
2026 Board-Deck Tooling Stack
The 2026 production stack: Causal or Mosaic for the operating dashboard and financial model, ChartMogul or Maxio for retention waterfall and cohort views, Salesforce or HubSpot for pipeline coverage and forecast, Gong or Clari for forecast accuracy and win-rate trend, Notion for collaborative slide drafting, Google Slides for distribution, and Notion AI or Claude for the T+1 meeting summary. Total cost: $30K to $60K per year for the stack at $10M to $40M ARR scale.
This stack pairs directly with the weekly CEO dashboard the same data feed runs both, which means the quarterly board deck is a 10x summary of what the CEO has been reading every Monday. The board sees what the CEO has been managing to, not a separate parallel reality.
The Seven Anti-Patterns Investors Hate
| # | Anti-pattern | Fix |
| 1 | 40-slide data dump with no narrative arc | 14-18 slides max; everything else in appendix. |
| 2 | Vanity metrics (MAU, "engagement") presented as KPIs | Use only Rule of 40, NRR, Burn Multiple, Magic Number, and the 12-metric scoreboard. |
| 3 | Quarter-to-quarter narrative arc collapse | Slide 2 carries the cumulative narrative; tough-news slides reference prior commitments. |
| 4 | Blame-shifting language ("the market was challenging") | Own the miss; name specific drivers; specific response actions with dates. |
| 5 | Late distribution (under 24 hours pre-meeting) | 48-hour minimum lead time per Sequoia, Bessemer, Craft guidance. |
| 6 | New definitions of old metrics every quarter | Lock metric definitions annually; document in appendix; only change with explicit board approval. |
| 7 | Empty or generic asks slide | Specific ask, named individual, deadline, expected outcome. No "general support" asks. |
Source: Lenny Rachitsky 2026, Bessemer board meeting framework, Craft Ventures.
Frequently Asked Questions
What should a SaaS board deck include?
The canonical 14-slide structure: Title, Executive Summary, Operating Scoreboard (12 metrics across Growth/Retention/Efficiency/Profitability), Growth Deep Dive, Retention Deep Dive (NRR/GRR waterfall), Efficiency Deep Dive, Profitability and Runway, Strategic Wins, Strategic Risks, Customer Voice, Hiring Plan, Capital Plan, Asks and Decisions, Appendix. Each slide has one job. The full deck runs 14-18 slides with appendix; anything longer triggers investor friction.
What are the 12 metrics every SaaS board deck must show?
Growth: New ARR, ARR Growth Rate, Pipeline Coverage. Retention: NRR, GRR, Logo Churn Rate. Efficiency: CAC Payback, Net Burn Multiple, Revenue per Employee. Profitability: Gross Margin, Rule of 40, Cash Runway. All 12 shown on one slide as the operating scoreboard, with current quarter, prior quarter, plan, year-ago comparisons, and traffic-light status colour coding.
How long should a SaaS board deck be?
14-18 slides plus appendix. The Lenny Rachitsky 2026 analysis of board-member preferences shows decks beyond 25 slides trigger frustration and are commonly skimmed rather than read. Slide 2 (Executive Summary) and Slide 3 (Operating Scoreboard) carry 70% of the information weight; the remaining slides exist to support, not duplicate.
How far in advance should I distribute the board deck?
48 hours minimum. Sequoia, Bessemer, Craft Ventures, and OpenView all converge on this number. The pre-read is what makes the meeting itself a strategic discussion instead of a reporting session. CEOs who distribute less than 24 hours ahead are signalling that the meeting is a performance, not a working session, which damages board trust over time.
What is the Rule of 40 and how do I show it on the board deck?
Rule of 40 = ARR Growth Rate (%) + EBITDA Margin (%). 40-60 healthy, 60+ top quartile, under 30 alarming. Rule of 40 above 50 commands a 74% valuation premium (4.8x EV/Revenue vs 2.7x for non-winners, Aventis Advisors 2026). Show on the operating scoreboard as a single number plus an 8-quarter trend line, with the components (growth + margin) visible so the board can see which lever is moving.
What is Net Burn Multiple and where does it belong on the board deck?
Net Burn Multiple = Net Burn ÷ Net New ARR. Under 1.0 excellent, 1.0-2.0 healthy, 2.0-2.5 average, over 2.5 warning. Bessemer 2026 documents Burn Multiple as the single highest-correlation valuation predictor post-2024. Place on the Efficiency Deep Dive slide as a quarterly bar chart with a target line at 1.5x; also include on the operating scoreboard.
How do I structure the tough-news slide when we miss?
Four parts: (1) problem stated cleanly in one sentence with no hedging; (2) diagnosis with 2-3 named drivers and percentages of the gap each explains; (3) response actions already taken with specific dates; (4) forward plan with named owner and date the recovery will be reported against. The structure separates CEOs who keep board trust from CEOs who lose it.
What is the right pipeline coverage to show on the board deck?
3x coverage healthy, 4x top quartile. Pipeline Coverage = Qualified Pipeline ÷ Next-Quarter Sales Target. Show on the Growth Deep Dive slide as a trend across the last 4 quarters with the target line at 3x. Pair with forecast accuracy (target within 10-15% quarterly per Gong and Clari 2026 benchmarks) so the board can see both pipeline math and forecasting discipline.
The quarterly board deck is the company's highest-leverage 2 hours. Architect it like one.
peppereffect installs the 14-slide canonical deck, the 12-metric operating scoreboard wired to your CRM and finance stack, the retention waterfall, the tough-news structure, the asks-slide framework, and the 30/14/7/2/0 prep cadence. The result: board meetings that compound trust instead of burning it, and a CEO back in the strategy seat instead of in deck-builder mode every quarter. escape the founder bottleneck
Architect Your Freedom MachineResources
- Sequoia: Preparing a Board Meeting
- Bessemer: A Board Meeting in Six Minutes
- David Sacks: The Cadence (Craft Ventures)
- Lenny Rachitsky: What Great Board Decks Look Like
- SaaStr: The Board Meeting Template Every CEO Should Use
- OpenView: Founder's Guide to Productive Board Meetings
- Serena Capital: The Perfect SaaS Board Deck Template
- Bessemer Atlas: State of the Cloud 2026
- Benchmarkit: 2026 SaaS Performance Metrics
- Aventis Advisors: Rule of 40 in SaaS 2026