The 2026 SaaS marketing budget is the most scrutinised line on the P&L. Sales-and-marketing spend across mid-market B2B SaaS has crept past $2 for every $1 of new ARR, up 14% since 2024. The board now expects every channel to defend itself with traceable pipeline, every tool to defend its line item with CAC payback math, and every hire to defend their seat with a documented contribution to Rule of 40. The CMO who survives 2026 is the one who replaces "we always spend 25% on paid social" with a zero-based seven-bucket framework that flexes with motion, ARR stage, and capital efficiency target.
This article installs that framework for $10M to $40M ARR B2B SaaS founders, CMOs, and CFOs. It covers the total spend benchmark, the marketing-vs-sales split, the seven-bucket allocation, the 2026 channel mix, the AI-augmented compression of CAC, the seven mistakes that cause boards to cut your budget, and the 30/60/90-day budget-setting plan. The framework interlocks with our SaaS growth strategy, customer acquisition cost benchmarks, and B2B demand generation playbook.
Strategic intent
A 2026 marketing budget is a portfolio allocation across seven operating buckets, not a single number. Set the envelope from Rule of 40 and Burn Multiple. Allocate by GTM motion and stage. Defend with CAC payback and pipeline contribution. Anything else is theatre.
Want to see your own CAC against peer benchmarks? Run the CAC Diagnostic for your true CAC, the 30 to 50% reduction agentic deployment delivers, and a board-ready PDF in 60 seconds.
Run the CAC DiagnosticHow Big Should the Marketing Budget Be?
The headline benchmark is straightforward. Cross-industry B2B marketing spend sits at a 9.1% median of revenue per the Spring 2026 CMO Survey, with Gartner reporting 7.7% across all sectors. B2B SaaS sits materially higher because LTV economics and expansion revenue justify earlier acquisition investment. The right total spend depends on three variables: ARR stage, GTM motion, and the capital efficiency target the board is signing off.
| ARR Stage | Combined S&M as % of revenue | Marketing share of S&M | Marketing as % of revenue |
| Under $10M ARR | 40-80% | 30-45% | 15-30% |
| $10M-$40M ARR | 30-50% | 35-45% | 12-18% |
| $40M-$100M ARR | 25-40% | 35-45% | 10-15% |
| $100M+ ARR | 20-30% | 30-40% | 8-12% |
Source: Bessemer Atlas 2026, ICONIQ 2025 State of GTM, OpenView 2025 SaaS Benchmarks, CMO Survey Spring 2026.
The Marketing-to-Sales Split by GTM Motion
The marketing-vs-sales split inside the S&M envelope is determined by the GTM motion, not by tradition. The framework below comes from the SaaS go-to-market strategy framework.
| GTM Motion | Marketing share | Sales share | Rationale |
| PLG-first with sales-assist | 55-65% | 35-45% | Product is the primary acquisition channel; marketing funds the demand engine |
| Hybrid product-led sales (dominant at $10M-$40M ARR) | 40-50% | 50-60% | PLG-led acquisition + sales-led expansion split S&M evenly |
| Sales-led inbound | 35-45% | 55-65% | Inbound demand engine plus content authority; sales converts |
| Outbound-led ABM | 25-35% | 65-75% | Enterprise sales motion absorbs most spend; marketing supplies ABM tooling |
Source: ICONIQ 2025 GTM, OpenView 2025 PLG.
The Seven-Bucket Allocation Framework
Inside the marketing envelope, the 2026 mid-market SaaS budget splits cleanly into seven operating buckets. Each bucket has a job, a metric it must defend, and a target percentage of total marketing spend. Headcount is shown twice because it is both an aggregate budget consideration and a constraint that overlays the other six.
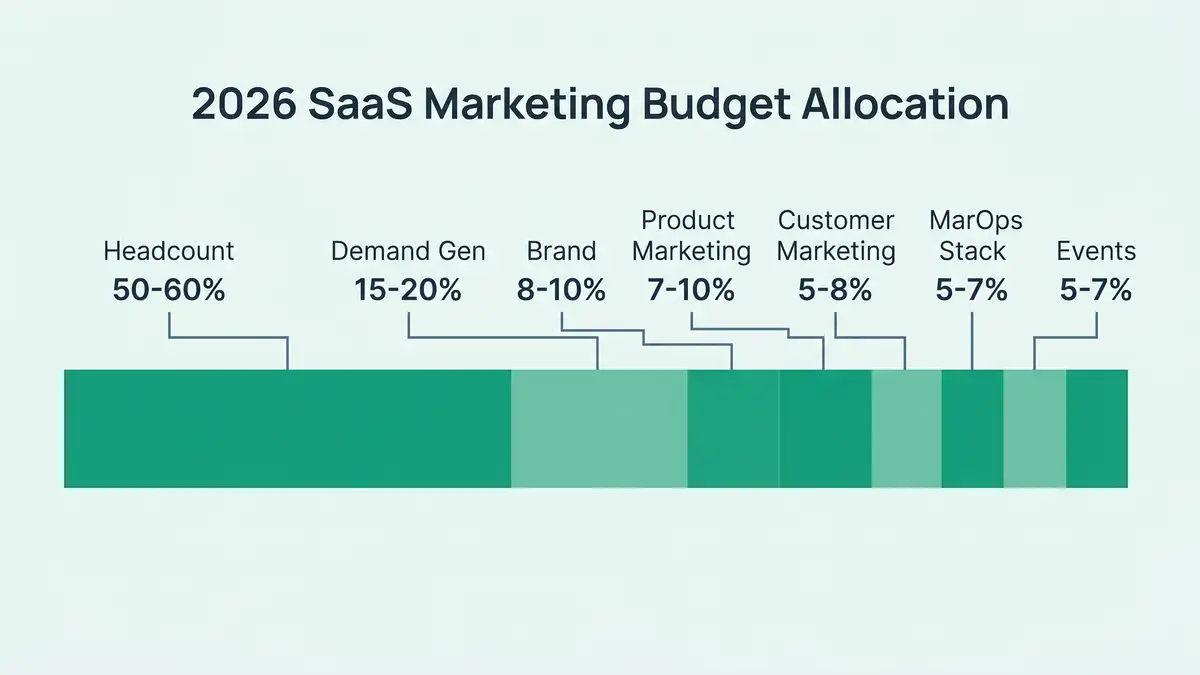
| Bucket | % of marketing budget | Job of the bucket | Defend with |
| 1. Demand Generation | 35-45% | Paid + content + outbound demand infrastructure that produces qualified pipeline | CAC payback per channel, pipeline coverage 3-4x |
| 2. Brand & PR | 8-12% | Mental availability for the 95% not yet in-market (Ehrenberg-Bass) | Branded search lift, share of voice, won-deal brand-influence cite rate |
| 3. Product Marketing | 8-12% | Positioning, sales enablement, launch motion, competitive intel | Win rate lift, sales-cycle compression, attach rate on new products |
| 4. Customer Marketing & Expansion | 10-15% | NRR contribution: advocacy, retention content, expansion campaigns, case studies | NRR delta vs control, advocacy programme yield, customer-led pipeline |
| 5. Marketing Operations & Tech Stack | 20-28% | CRM, automation, attribution, AI agents, data pipeline | Funnel velocity, attribution coverage, AI productivity multiplier |
| 6. Events & Field Marketing | 5-8% | Conferences, founder dinners, regional ABM events, partner co-marketing | Pipeline per dollar event, named-account meeting rate, partner-sourced revenue |
| 7. Headcount (overlay) | 50-70% of total when fully loaded | 8-15 marketing FTEs at $150-$250K fully loaded per FTE for $10M-$40M ARR | Revenue per marketing FTE, output per FTE post-AI augmentation |
Source: synthesis of CMO Survey Spring 2026, Bessemer 2026, ICONIQ 2025 GTM, HubSpot State of Marketing 2026.
The 2026 Channel Mix Inside Demand Generation

Demand generation is the largest single bucket and the most over-spent. The 2026 channel mix shifts toward owned and AI-augmented channels and away from paid social as CPMs continue to inflate. The framework below is for a $25M ARR hybrid PLS company; the percentages flex by motion.
| Channel | % of demand gen budget | 2026 median CAC | Best for |
| SEO + content (including GEO and AEO) | 20-30% | $150-$400 | Top-of-funnel compounding demand; AI search visibility |
| Paid search (Google + Bing) | 15-20% | $500-$1,200 | Bottom-funnel intent capture |
| Paid social (LinkedIn dominant for B2B) | 15-20% | $800-$1,800 | ABM amplification and thought leadership |
| Outbound + AI SDR (Clay, Apollo, 11x.ai) | 10-15% | $39-$262 per qualified lead | Named-account reach at AI-compressed cost |
| Partner + co-marketing | 5-10% | $200-$600 | Lowest-CAC channel when the partner is well-matched |
| Podcast + influencer + sponsorship | 5-10% | $400-$1,500 | Brand-and-demand hybrid; long-tail content asset |
| Lifecycle and retention marketing | 10-15% | NRR contribution, not CAC | Expansion revenue compounding |
Source: HubSpot State of Marketing 2026, Directive Consulting 2026 B2B Benchmarks, First Page Sage 2026 SaaS CAC, The Signal Club 2026 GTM Tech Stacks.
The 60/40 Brand vs Activation Split
Inside the marketing envelope, the LinkedIn B2B Institute and Binet & Field "long and short of it" framework applies: 60% of budget should fund long-term brand-building demand and 40% should fund short-term activation. Mid-market SaaS routinely inverts this ratio and over-indexes on activation, which produces near-term pipeline at the cost of brand decay and rising CAC over 12-24 months.
The activation trap
If 80%+ of your marketing budget runs into paid search, paid social, and outbound, you are not running a marketing function. You are running a performance media buyer. The Ehrenberg-Bass 95-5 rule still holds: only 5% of your ICP is in-market this quarter. The other 95% only remembers you if the long-term brand budget did its job.
The Headcount Math at $10M-$40M ARR
Marketing FTEs eat 50-70% of the fully loaded marketing budget at this stage. A $25M ARR company at the median 14% marketing-to-revenue ratio runs a $3.5M annual marketing budget; with 60% allocated to headcount, that funds approximately 14 FTEs at $150K fully loaded. The typical org structure is one VP Marketing, two demand-gen managers, two content writers, one product marketing manager, one customer marketing manager, two marketing operations, one PR / brand lead, one events lead, two AI-augmented roles (often growth engineers). AI augmentation now lets a 10-12 person team deliver the output a 18-20 person team produced in 2023.
AI-Augmented Marketing in 2026: The Compression Layer
The Signal Club's 2026 analysis of fastest-growing private B2B shows 65% use Clay for prospecting and zero use an off-the-shelf AI SDR. The pattern: build a modular AI stack (Clay + Apollo + Default + Common Room + Common's intent signals) layered on top of HubSpot or Salesforce. Forrester's 2026 marketing predictions document 40-70% CAC compression for early adopters across prospecting, content production, ad creative, and analytics. The pragmatic budget shift: move 10-15% of demand-gen budget from agency retainers to AI tooling and growth-engineering headcount, then recapture the productivity by holding FTE count flat instead of expanding it.
Want a zero-based 2026 marketing budget tied to your CEO dashboard, Rule of 40 target, and pipeline coverage requirements?
Book a Freedom Machine DiagnosticWorked Example: The First $3M Marketing Budget
For a $25M ARR hybrid PLS company at the median 14% marketing-to-revenue ratio, the annual marketing envelope is $3.5M. Allocated through the seven-bucket framework:
Headcount: $2.1M (60% of $3.5M)
14 FTEs at $150K fully loaded. VP Marketing, 2 demand gen, 2 content, 1 PMM, 1 CMM, 2 marops, 1 PR/brand, 1 events, 2 AI growth engineers, 1 designer.
Demand Generation (programs): $560K (16% of $3.5M)
$170K paid search, $140K paid social (LinkedIn), $100K outbound AI tooling, $80K partner co-marketing, $70K podcast/sponsorship. Anchored to 3x pipeline coverage and sub-15-month CAC payback per channel.
Brand & PR: $245K (7%)
PR retainer, founder podcast tour, original research, thought-leadership LinkedIn programme. Long-term mental availability for the 95% not in-market.
Product Marketing: $175K (5%)
Mostly headcount but with budget for launches, sales enablement assets, competitive intel subscriptions, win-loss interviews.
Customer Marketing & Expansion: $200K (6%)
Case study production, advocacy programme, expansion campaigns, customer events. Defends NRR contribution.
Marketing Operations + Tech Stack: $245K (7%)
HubSpot or Salesforce + Marketo, Clay, Apollo, Common Room, Gong, attribution platform, design tools, AI tooling. Total $30-$60K per year on AI stack alone.
Events & Field: $175K (5%)
2-3 sponsored conferences, 6-8 founder dinners, ABM regional pop-ups, partner field events. Anchored to named-account meeting rate and partner-sourced revenue.
Total: $3,700K, slightly above the $3.5M envelope because programs and stack rounded up. Trim 5% from demand gen programs or push the AI compression target harder, and the budget lands.
The Seven Mistakes That Cause Boards to Cut Your Budget
| # | Mistake | Fix |
| 1 | Over-indexing on paid acquisition when content compounds | 20-30% of demand gen on SEO/content/GEO; track 12-month compounding pipeline contribution. |
| 2 | Under-investing in product marketing | 8-12% of marketing budget; defend with win-rate lift and sales-cycle compression. |
| 3 | Zero customer marketing budget at $20M+ ARR | 10-15% of marketing budget on advocacy, expansion campaigns, retention content; defend with NRR delta. |
| 4 | Ignoring AEO / GEO and AI search visibility | Allocate 10-15% of content budget specifically to AI-citation optimisation; track citation rate in ChatGPT, Perplexity, Claude. |
| 5 | Sales-led companies under-investing in inbound demand | Even sales-led motions need a content + brand engine. Minimum 25% of marketing budget on inbound infrastructure. |
| 6 | Activation 80%, brand 20% (Ehrenberg-Bass violation) | Reset toward 60/40 brand-to-activation per Binet & Field over a 12-month rebalance. |
| 7 | Defending budget with vanity metrics | Defend with CAC payback, pipeline coverage, NRR delta, Rule of 40 contribution, revenue per marketing FTE. |
Source: ICONIQ 2025 GTM, Bessemer 2026, LinkedIn B2B Institute.
The 30/60/90-Day Budget-Setting Plan
Days 1-30: Diagnose the current allocation
Map every dollar of last-year marketing spend across the 7 buckets. Compute CAC payback by channel. Compute revenue per marketing FTE. Identify the top three over-spent buckets and the top two under-spent ones. Output: written diagnostic memo.
Days 31-60: Re-architect using the seven-bucket framework
Zero-base the next 12 months. Lock total envelope to 12-18% of revenue (anchored to Rule of 40 and Burn Multiple targets). Allocate by GTM motion. Build the channel mix inside demand gen. Test 10-15% reallocation toward AI tooling and growth-engineering headcount.
Days 61-90: Build the defense dossier
Tie every bucket to a defendable metric (CAC payback, pipeline coverage, NRR delta, Rule of 40 contribution). Present to CFO and board with the 14-slide board deck. Commit to quarterly reviews against the same metric set.
Frequently Asked Questions
How much should B2B SaaS spend on marketing?
Cross-industry B2B marketing spend sits at 9.1% of revenue median per Gartner CMO Spend Survey 2026. B2B SaaS sits higher because LTV economics justify earlier acquisition investment. Under $10M ARR: 15-30% of revenue. $10M-$40M ARR: 12-18%. $40M-$100M ARR: 10-15%. $100M+ ARR: 8-12%. The total combined sales-and-marketing envelope at $10M-$40M ARR runs 30-50% of revenue, with marketing taking 35-45% of that envelope.
What is the marketing-to-sales split for SaaS?
Determined by GTM motion, not tradition. PLG-first: 55-65% marketing / 35-45% sales. Hybrid product-led sales (dominant at $10M-$40M ARR): 40-50% / 50-60%. Sales-led inbound: 35-45% / 55-65%. Outbound-led ABM: 25-35% / 65-75%. Use the GTM motion to set the split, not industry averages.
How should I allocate a $3M SaaS marketing budget?
Through the seven-bucket framework. Headcount 50-70% fully loaded ($1.5M-$2.1M for 10-14 FTEs). Demand gen programs 35-45% of remaining ($350K-$500K). Brand & PR 8-12% ($240K-$360K). Product marketing 8-12% ($240K-$360K). Customer marketing 10-15% ($300K-$450K). Marketing operations & tech stack 20-28% ($600K-$840K). Events 5-8% ($150K-$240K). Each bucket defends against a specific metric: CAC payback, pipeline coverage, win-rate lift, NRR delta.
What channels deliver the lowest SaaS CAC in 2026?
Partner co-marketing ($200-$600), SEO/content/AEO ($150-$400), AI-augmented outbound with Clay/Apollo/11x.ai ($39-$262 per qualified lead). Paid search runs $500-$1,200, paid social $800-$1,800. Outbound SDR without AI augmentation has risen to $1,980 median in 2026. The pattern: reallocate from manual outbound and high-CPM paid social toward owned (content) and AI-augmented (Clay/Apollo) channels.
What is the 60/40 brand vs activation rule?
From LinkedIn B2B Institute and Binet & Field's "Long and Short of It" research: 60% of marketing budget should fund long-term brand-building and 40% short-term activation. The Ehrenberg-Bass 95-5 rule supports this: only 5% of your ICP is in-market this quarter, so the 95% only remembers you if brand spend did its job. Mid-market SaaS routinely inverts to 80% activation / 20% brand and pays for it 12-24 months later through CAC inflation.
How much of the marketing budget should go to martech?
20-28% of total marketing budget for mid-market SaaS in 2026, covering CRM, marketing automation, attribution, AI agents, intent data, and design tools. Total stack cost at $10M-$40M ARR typically runs $200K-$500K annually, with AI-specific tools (Clay, Apollo, Common Room, etc.) adding $30K-$80K. The 2026 shift: move 10-15% of demand-gen spend toward AI tooling and growth-engineering headcount instead of agency retainers.
How do AI tools reduce SaaS marketing CAC?
Forrester 2026 documents 40-70% CAC compression for early adopters across four levers: (1) AI-augmented prospecting (Clay, Apollo, 11x.ai) at $39 vs $262 per qualified lead; (2) AI content production cutting cost by 50-70% while maintaining quality; (3) AI ad creative generating 3-5x variant volume; (4) AI analytics surfacing attribution insights faster. 65% of fastest-growing private B2B companies use Clay; zero use an off-the-shelf AI SDR. The winning pattern is modular AI stack on top of HubSpot or Salesforce.
How do I defend the marketing budget to the CFO?
Tie every bucket to a defendable metric. Demand gen: CAC payback under 18 months, pipeline coverage 3-4x. Brand: branded search lift, won-deal brand-influence cite rate. Product marketing: win-rate lift, sales-cycle compression. Customer marketing: NRR delta vs control. Marketing operations: funnel velocity, attribution coverage. Events: pipeline per dollar event. Headcount: revenue per marketing FTE. Present in the quarterly board deck tied to Rule of 40 contribution. Vanity metrics get budgets cut; CAC-defended metrics get budgets defended.
Stop arguing about the marketing budget every quarter. Engineer it once, defend it forever.
peppereffect installs the seven-bucket marketing budget framework, the AI-augmented stack that compresses CAC by 40-70%, the channel mix wired to your GTM motion, and the defense dossier that turns the CFO and board into allies instead of auditors. Result: a marketing function that compounds Rule of 40 instead of consuming runway.
Architect Your Freedom MachineResources
- The CMO Survey: Spring 2026
- HubSpot: 2026 State of Marketing Report
- HubSpot Blog: Marketing Budget by Industry 2026
- Directive Consulting: B2B Marketing Budget Benchmarks 2026
- 42dm: 2026 B2B SaaS Marketing Budget Guide
- Bessemer Atlas: State of the Cloud 2026
- ICONIQ Growth: 2025 State of Go-to-Market
- OpenView: 2025 SaaS Benchmarks
- LinkedIn B2B Institute: The Long and the Short of It (Binet & Field)
- The Signal Club: GTM Tech Stacks of Fastest-Growing B2B
- Forrester: 2026 Marketing Predictions
- First Page Sage: 2026 B2B SaaS CAC by Channel