The 2026 B2B SaaS CEO who waits for the quarterly board deck to learn that NRR has slipped is already three quarters too late. Top-decile CEOs compress that lag from 90 days to 7 with a single-page Monday dashboard. Twelve metrics. Four quadrants (Growth, Retention, Efficiency, Profitability). One 30-minute weekly review with the CFO and Head of Sales. The output: 1 to 3 priority interventions per week and a company that catches drift while it is still correctable. This guide installs that dashboard for $10M to $40M ARR B2B SaaS (Sarah Chen). Operations/Management pillar. The objective is to convert SaaS CEO metrics from a quarterly retrospective into a weekly operating discipline.
Why Monday, not quarterly
The lag between a metric breaking and the board hearing about it is typically 4 to 8 weeks at companies running monthly reviews and 12+ weeks at companies running quarterly board cycles. David Sacks's operating cadence framework documents the canonical fix: weekly metrics review on Monday with the operating leadership team. Weekly cadence catches drift while it is still a small intervention. Monthly catches it after a quarter of damage. Quarterly catches it after the customer has already churned and the AE has already missed plan.
The single-page rule matters as much as the cadence. Fanruan's 2026 SaaS dashboard analysis documents the failure mode: 30-metric dashboards nobody reads. The CEO version compresses to 12 because that is the upper bound of working memory in a 30-minute review.
The Monday Dashboard Test
If your CEO cannot answer "did NRR move last week, and if so, who owns the explanation by Wednesday" in under 60 seconds on Monday morning, the dashboard is too long, too lagging, or non-existent. Top-decile programmes hit all three: 12 metrics, weekly cadence, single-page format. The discipline is the input that makes capital-efficient growth possible.
Want to see your own CAC against peer benchmarks? Run the CAC Diagnostic for your true CAC, the 30 to 50% reduction agentic deployment delivers, and a board-ready PDF in 60 seconds.
Run the CAC DiagnosticThe 12-metric structure across 4 quadrants
Twelve metrics, organized into four quadrants of three. The structure forces balance: a CEO who only watches Growth will burn cash; a CEO who only watches Profitability will starve growth.
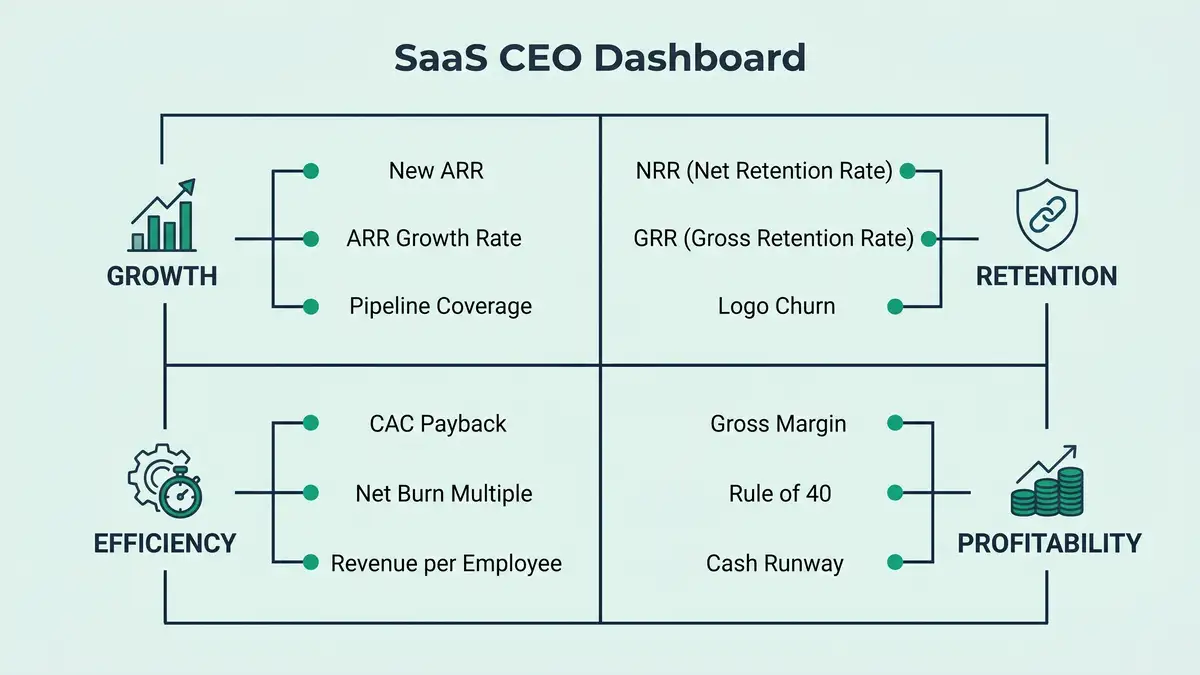
Quadrant A: Growth (3 metrics)
1. New ARR (this week vs target): The leading indicator of growth trajectory. Weekly target derived from quarterly plan. Owner: Head of Sales. Healthy: tracking to plan within 10%. Alarming: under 80% of weekly target two weeks running.
2. ARR Growth Rate (annualized monthly run-rate): Where the company is heading on a 12-month basis. Healthy 25 to 40% YoY for $10M to $40M ARR cohort. Top quartile clears 50%. Source: GSquared CFO 2026 SaaS Benchmarks.
3. Pipeline Coverage (3-4x quota): The leading indicator that the next two quarters of New ARR will hit. Healthy 3 to 4x. Below 2.5x is structural under-pipeline. Owner: Head of Sales / RevOps.
Quadrant B: Retention (3 metrics)
4. Net Revenue Retention (NRR): The single highest-correlation metric for SaaS valuation. Healthy 105 to 115% Mid-Market, top quartile 120%+. Net revenue retention is the load-bearing CEO metric.
5. Gross Revenue Retention (GRR): Strips out expansion to show pure retention. Healthy 85 to 92%, top quartile 95%+. The gap between NRR and GRR shows whether expansion is masking churn.
6. Logo Churn Rate (annual): Customer-count retention. Healthy 3 to 5%, alarming over 7%. SaaS churn analysis is the deep diagnostic.
Quadrant C: Efficiency (3 metrics)
7. CAC Payback Period: Months to recover blended CAC. Healthy 14 to 22 months, top quartile under 14. Prospeo's 2026 CAC LTV guide documents the benchmark structure.
8. Net Burn Multiple: Net Burn / Net New ARR. Excellent under 1.0, healthy 1.0 to 2.0, warning above 2.5. The post-ZIRP era's highest-correlation metric for valuation. See scale revenue without headcount.
9. Revenue per Employee (RPE): Annualized ARR / FTE count. Healthy $200K to $280K, top quartile $300K+, top decile $400K+. The headcount discipline metric that compounds with the other 11.
Quadrant D: Profitability (3 metrics)
10. Gross Margin: (Revenue − COGS) / Revenue. Healthy 70 to 78% B2B SaaS, top quartile 78%+. Below 65% signals infrastructure or services drag that crushes operating leverage.
11. Rule of 40: Revenue Growth % + EBITDA Margin %. Healthy 40 to 60, top quartile over 60. Rule of 40 is the canonical valuation predictor.
12. Cash Runway (months): Cash on hand / monthly net burn. Healthy 18+ months, alarming under 12. The lagging-but-existential metric that determines optionality.

The 2026 benchmark table for the $10M to $40M ARR cohort
| Metric | Healthy | Top-Quartile | Alarming |
| ARR Growth Rate (YoY) | 25-40% | 50%+ | under 15% |
| Pipeline Coverage | 3-4x | 4x+ | under 2.5x |
| NRR (Mid-Market) | 105-115% | 120%+ | under 95% |
| GRR | 85-92% | 95%+ | under 80% |
| Logo Churn (annual) | 3-5% | under 3% | over 7% |
| CAC Payback | 14-22 months | under 14 | over 30 |
| Net Burn Multiple | 1.0-2.0 | under 1.0 | over 2.5 |
| Revenue per Employee | $200K-$280K | $300K+ | under $130K |
| Gross Margin | 70-78% | 78%+ | under 65% |
| Rule of 40 | 40-60 | over 60 | under 30 |
| Cash Runway | 18+ months | 24+ months | under 12 |
Sources: Phoenix Strategy 2026, GSquared CFO 2026, Averi 2026, Hubifi B2B SaaS Benchmarks, Consult EFC ARR Multiples 2026.
The structural insight: top-quartile B2B SaaS hits the right side of the table not because of single heroic moves, but because the weekly dashboard catches drift early enough to fix it. Customer success metrics, B2B customer retention strategy, and expansion revenue strategy are the operational layers that make the retention metrics move; the dashboard is the discipline that holds them accountable.

Leading vs lagging classification
| Classification | Metrics | What it tells the CEO |
| LEADING | Pipeline Coverage, New ARR (this week) | Where growth is headed in 4-12 weeks |
| COINCIDENT | NRR, ARR Growth Rate, CAC Payback, Net Burn Multiple, Logo Churn | Where the company is right now |
| LAGGING | GRR, Gross Margin, Rule of 40, Revenue per Employee | What happened in the prior 1-4 quarters |
| EXISTENTIAL | Cash Runway | How long the company has to fix everything else |
Sources: Capitaly / David Sacks Operating Cadence, Fanruan SaaS Dashboards 2026.
The trap most CEOs fall into is over-weighting lagging metrics. By the time Rule of 40 has slipped, the levers that move it have been broken for 6 to 12 months. Top-decile CEOs allocate 50% of weekly review time to leading and coincident metrics, 30% to lagging, 20% to existential.

The seven-step dashboard install
Define the 12 metrics with precise formulas
NRR is not "kind of like net retention." It is (Starting MRR + Expansion − Contraction − Churn) / Starting MRR. Document the formula, the data source, and the calculation owner for each of the 12 metrics. Half the disputes in SaaS leadership meetings are definitional.
Stand up the data pipeline
Connect billing (Stripe, Maxio, Paddle) to analytics (ChartMogul, Mosaic, Causal) to CRM (Salesforce, HubSpot) to FP&A. The dashboard updates automatically by Sunday night so the CEO sees fresh numbers Monday morning.
Build the single-page visual
Four quadrants, three metrics each, 12-week trend line per metric, color-coded tier indicator (red/amber/green vs benchmark), drill-down link from each metric to its operational dashboard. The CEO version is summary; the operational dashboards are detail.
Assign one owner per metric
Every metric has a single named owner who explains the movement when asked. New ARR: Head of Sales. NRR: Head of Customer Success. CAC Payback: CMO + Head of Sales jointly. Cash Runway: CFO. The "we'll figure it out together" pattern dies on Day 1.
Run the 30-minute Monday review
CEO + CFO + Head of Sales (+ Head of CS for retention deep-dives). Each tier-amber or tier-red metric: owner explains in under 90 seconds, names the intervention, commits a deadline. Output: 1-3 weekly priority interventions captured in writing. No more than 3.
Cascade to functional dashboards
Each of the 12 metrics has a tier-2 dashboard that the metric owner reviews weekly. The CEO dashboard is the summary; the functional dashboards are where actual intervention happens. Customer health scores, sales pipeline management, and CSM cadences feed up.
Recalibrate quarterly
The 12 metrics that matter at $10M ARR are different from the 12 that matter at $50M. At Series A, focus shifts to ARR growth + Net Burn Multiple + Cash Runway. At Series C, profitability and Rule of 40 dominate. Top-decile programmes review the dashboard composition every 90 days.

Six failure patterns that destroy CEO dashboards
Failure 1: 30 metrics nobody reads
The instinct to be comprehensive produces dashboards CEOs skim and ignore. 12 is the upper bound for a 30-minute weekly review. Anything more is theater.
Failure 2: Point-in-time numbers without trend lines
"NRR is 108%" tells the CEO nothing. "NRR was 114% twelve weeks ago, fell to 109% over six weeks, recovered to 112% over the last three" tells them everything. Always include 12-week trend lines.
Failure 3: No benchmark context
"NRR is 108%" with no benchmark is meaningless. "NRR is 108%, top quartile is 120%, our peer median is 105%" creates the diagnostic frame. Color-code every metric against the 2026 benchmark table.
Failure 4: No owner per metric
Metrics without owners are decorations. Every metric needs one named owner accountable for the explanation and the intervention. The "we as a team" pattern is the death of the dashboard.
Failure 5: Skipping the weekly review when "nothing changed"
The weeks the dashboard looks fine are the weeks small drifts compound into quarter-killing problems. The 30-minute Monday cadence is non-negotiable; only the depth varies.
Failure 6: Treating the dashboard as financial reporting
The CEO dashboard is operational, not retrospective. It exists to drive 1-3 priority interventions per week, not to document the past. Programmes that confuse the two end up with beautiful dashboards and stagnant operations.
The 90-day install plan
Days 1-30: Define and instrument
Lock the 12-metric definitions and formulas. Assign owners. Connect the data pipeline (billing + CRM + analytics + FP&A). Output: definitions documented, data flowing, baseline measurements captured.
Days 31-60: Build and pilot
Stand up the single-page dashboard with 12-week trend lines and benchmark color-coding. Run 4 weekly Monday reviews with the leadership team. Refine the visual after each review. Output: dashboard live, weekly cadence in place.
Days 61-90: Cascade and recalibrate
Deploy tier-2 functional dashboards (one per metric owner). Capture the first quarter of priority interventions and their outcomes. Run the first quarterly recalibration to retire any metrics that did not drive intervention. Output: full operating cadence live.
What "good" looks like at 12 months
- Weekly Monday review run 50+ times in the year (no skipped weeks).
- Average 1.8 priority interventions captured per week, with documented outcomes.
- Time-to-detection of any metric breaking: under 7 days (vs 4 to 12 weeks pre-dashboard).
- NRR drift caught and corrected at 2-point movement (vs 8-point movement pre-dashboard).
- Cash runway always known to within 1 month, never a surprise.
- Board reviews accelerate 30 to 50% because the data is already familiar.
- Operational dashboards cascade cleanly from CEO to functional leaders.
- Quarterly recalibration retires 1 to 2 stale metrics and adds 1 to 2 new ones to fit company stage.
Those deltas are the natural compounding of running the discipline weekly. The dashboard is the operating cadence that turns capital efficiency from a board metric into a Monday habit. SaaS unit economics and the decouple revenue from headcount playbook give the strategy. The CEO dashboard gives the cadence.
Want a diagnostic on whether your CEO dashboard is engineering capital efficiency or just decorating board decks?
FAQ
What metrics should a SaaS CEO check every week?
The canonical 12 organized in 4 quadrants. Growth: New ARR, ARR Growth Rate, Pipeline Coverage. Retention: NRR, GRR, Logo Churn Rate. Efficiency: CAC Payback, Net Burn Multiple, Revenue per Employee. Profitability: Gross Margin, Rule of 40, Cash Runway. Twelve is the upper bound for a 30-minute Monday review; more than that produces dashboards CEOs skim and ignore.
What is a SaaS CEO dashboard?
A SaaS CEO dashboard is a single-page operating dashboard, reviewed every Monday with the CFO and Head of Sales, that shows 12 metrics across Growth, Retention, Efficiency, and Profitability with 12-week trend lines and color-coded benchmark tiering. The objective is to compress the lag between a metric breaking and the leadership team intervening from 4 to 12 weeks down to 7 days, producing 1 to 3 priority interventions per week.
What is a good NRR for B2B SaaS?
For 2026 B2B SaaS Mid-Market: healthy 105 to 115%, top quartile 120%+, alarming under 95%. Enterprise tier targets are 110 to 120% healthy and 130%+ top quartile. NRR is the single highest-correlation metric for SaaS valuation and the load-bearing CEO retention metric. The gap between NRR and GRR shows whether expansion is healthy or is masking churn.
What is the Rule of 40?
Rule of 40 = ARR Growth Rate (%) + EBITDA Margin (%). Healthy 40 to 60, top quartile 60+, alarming under 30. Rule of 40 above 50 commands 7 to 12x revenue multiples. It is the canonical valuation predictor and one of the four Profitability quadrant metrics on the CEO dashboard.
How is CAC Payback calculated?
CAC Payback (months) = (Blended CAC / Gross Profit per New Customer) × 12. For a $5K CAC, $2K ARR per customer, 75% gross margin: payback = ($5K / ($2K × 0.75)) × 12 = 40 months (alarming). Healthy 14 to 22 months, top quartile under 14, alarming over 30. Compress through ACV optimization, gross margin lift, and expansion compounding.
What is Net Burn Multiple?
Net Burn Multiple = Net Burn / Net New ARR. The number of dollars consumed to generate one dollar of new ARR. Excellent under 1.0, healthy 1.0 to 2.0, average 2.0 to 2.5, warning above 2.5. Bessemer 2026 documents Burn Multiple as the highest-correlation predictor of B2B SaaS valuation post-2024. The discipline anchor of the Efficiency quadrant.
How often should a CEO review SaaS metrics?
Weekly on Monday morning, 30 minutes, with the CFO and Head of Sales. Monthly is too slow for sales-cycle moves. Quarterly is retrospective only. Daily is over-fitting to noise. The Monday cadence catches drift while interventions are still small and produces 1 to 3 priority items per week, no more.
What tools do SaaS CEOs use for dashboards?
For $10M to $40M ARR: ChartMogul or Maxio for SaaS analytics ($10K to $30K/year), Mosaic or Causal for FP&A and runway modeling ($15K to $40K/year), Salesforce or HubSpot for CRM, Stripe or Paddle for billing. Total dashboard tooling stack runs $30K to $80K/year. Tooling does not produce dashboard discipline; the weekly cadence does.
Architect a CEO dashboard that compounds capital efficiency, not one that decorates board decks.
peppereffect installs end-to-end CEO operating dashboards for $10M to $40M ARR B2B SaaS: the 12-metric framework, the data pipeline, the weekly cadence, the tier-2 functional cascade, the quarterly recalibration. Logic-gated execution, not retainer hours.
Book a Growth Mapping Call when to hire your first VP of Sales GTM strategy diagnostic quarterly board deck template marketing budget defense framework Technician's Trap for SaaS CEOs
Resources
- Capitaly, David Sacks Operating Cadence and CEO Dashboard
- Fanruan, SaaS Dashboard Examples 2026
- Phoenix Strategy, SaaS KPI Benchmarks 2026
- GSquared CFO, SaaS Benchmarks 2026
- Averi, 3 SaaS Metrics That Matter More Than MRR 2026
- Hubifi, B2B SaaS Benchmarks Churn CAC LTV Growth
- Hubifi, 7 Key SaaS Metrics for Investors
- Prospeo, CAC LTV Ratio 2026 Guide
- Fred Sazy, 10 SaaS Metrics to Stay Profitable
- Consult EFC, SaaS ARR Multiples 2026
- Pay Pro Global, SaaS Revenue Growth Rate
- Bessemer, State of the Cloud 2026
- OpenView, 2025 SaaS Benchmarks
- ChartMogul, 2026 SaaS Benchmarks
- Maxio, SaaS Metrics Glossary
- Mosaic, SaaS CFO Dashboard
- Causal, SaaS Financial Modeling
- Reforge, Operating Cadence Frameworks
- Lenny's Newsletter, SaaS Metrics Deep Dive
- HBR, Managing With Data