

Sales pipeline management in 2026 is the deal-flow operating system that determines whether revenue is predictable or chaotic. Sarah Chen-style mid-market SaaS founders walk into Monday forecast calls staring at a CRM full of "happy ears" deals stuck in stage 4 for 67 days, AEs marking close-dates as "this Friday" for the third quarter running, and pipeline coverage ratios that look fine until you weight by stage age. The fix is architectural: install six-stage pipeline definitions with explicit exit criteria, run a 3x-5x coverage ratio gated by win rate, lock weekly forecast cadence with documented inspection rituals, and switch the headline metric from pipeline volume to pipeline velocity. This playbook walks the 2026 architecture, the forecast accuracy spine, and a 90-day rollout that compresses sales cycles 15-25%.
The peppereffect view
Sales pipeline management is not CRM hygiene — it is the deterministic deal-routing logic between qualified demand and closed revenue. Architect it as six stages with explicit exit criteria, run a coverage ratio mathematically derived from win rate and cycle length, lock the weekly forecast call as a deal-inspection ritual, and measure pipeline velocity (deals × ACV × win-rate / cycle length) as the headline metric. Coverage volume without velocity discipline is just a vanity dashboard.
What sales pipeline management actually is in 2026
Sales pipeline management is the discipline of stewarding deals through documented stages with explicit exit criteria, monitoring stage health metrics, running the forecast inspection rituals that surface risk early, and reallocating coaching capacity to the deals where AE intervention will move the needle. The 2018 version was "review the CRM weekly." The 2026 version is a multi-layer system: stage definitions tied to MEDDIC qualification gates, weighted coverage ratios calibrated to actual win rate by segment, predictive deal scoring augmented by AI-driven conversation intelligence, and forecast cadences with documented escalation paths.
The architectural rewrite follows three structural shifts. First, sales cycles lengthened. Median B2B SaaS sales cycles now sit at 60-90 days; deals beyond 90 days correlate with stage-stuck patterns and forecast decay. Second, coverage ratio math got mainstream. The 3x-5x coverage benchmark is now table stakes — but the actual ratio you need is your inverse win rate, multiplied by a slippage factor for stage-age and quarter timing. Third, AI-driven conversation intelligence collapsed forecast inaccuracy. Platforms like Gong and Clari now surface deal risk signals (no decision-maker in last call, pricing not discussed, next step not scheduled) that human pipeline reviews miss 60-70% of the time.
The compounding effect: organisations with documented stage-gate disciplines hold win-rate variance below 8% month-over-month; teams without stage discipline see 15-25% variance and run perpetual forecast misses. Pipeline coverage below 3x at the start of a quarter correlates with forecast miss probability above 40%.
The "more pipeline" trap
The reflex when revenue lags is "we need more pipeline." Sometimes that's right. More often the issue is pipeline quality, not quantity — too many low-fit deals coasting on engagement metrics, too many stage-stuck deals nobody's willing to disqualify, too many AEs sandbagging Commit/Best-Case categories. Adding 30% more pipeline volume to a 6% velocity programme delivers less revenue than holding volume flat and lifting velocity to 9%.
The six-stage pipeline architecture
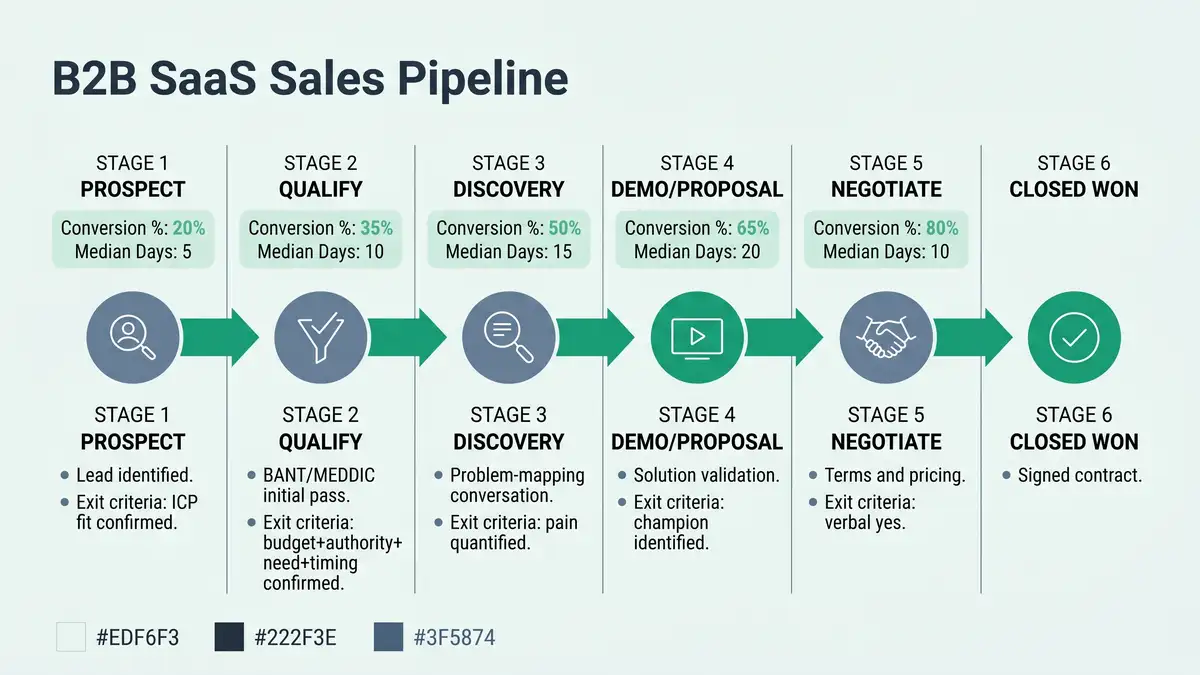
Every defensible 2026 B2B SaaS pipeline runs six stages with explicit exit criteria. Deals don't advance because the AE moves the card; deals advance because the stage exit criteria are demonstrably met. Without explicit criteria, pipeline becomes opinion-driven and forecast accuracy collapses.
Prospect — lead identified, ICP fit confirmed
SDR or marketing-sourced lead enters the pipeline only after firmographic fit gate passes. Median days in stage: 1-3. Exit criteria: ICP fit confirmed via firmographic enrichment + initial conversation booked. Conversion to next stage: 35-55% in healthy programmes.
Qualify — BANT/MEDDIC initial pass
Initial qualification call. Budget-Authority-Need-Timing or MEDDIC components covered. Median days in stage: 5-10. Exit criteria: budget tier confirmed, decision-maker access path identified, named pain mapped to product capability, decision timing within 90-180 days. Conversion: 50-65%.
Discovery — pain quantified, champion identified
Deeper problem-mapping conversation. Quantify cost of status quo, identify internal champion, map buying committee. Median days in stage: 7-14. Exit criteria: dollarised pain, champion confirmed, 2+ stakeholders engaged. Conversion: 55-70%.
Demo / proposal — solution validation
Tailored demo against documented pain. Proposal delivered with line-item ROI. Median days in stage: 10-21. Exit criteria: positive demo verdict, proposal acknowledged, technical/legal review initiated. Conversion: 45-60%.
Negotiate — terms and pricing
Pricing, redlines, contract terms. Median days in stage: 7-21. Exit criteria: verbal yes from economic buyer, redlines resolved, signature path identified. Conversion: 75-85% from negotiate to closed-won (the highest-converting stage in any healthy pipeline).
Closed won — signed contract
Contract counter-signed, kickoff scheduled. Triggers handoff to onboarding and customer success. Days in stage: 0-2 (instantaneous). Total cycle from prospect to closed won: 60-90 days for healthy mid-market B2B SaaS.
The pipeline coverage ratio math

Pipeline coverage ratio is the most predictive forecast accuracy metric in B2B SaaS. The standard 3x-5x benchmark is right but lazy — the actual coverage ratio you need is mathematically derived from your win rate and adjusted for stage-age and quarter timing.
The formula: Required Coverage = (1 / Win Rate) × Slippage Factor. With a 25% win rate and a 1.2x slippage factor (typical B2B SaaS), required coverage = 4.8x. Below 3x at quarter start, forecast miss probability rises above 40%; above 6x without velocity discipline, you're carrying too much stage-stuck deadwood. The right number for your business is your number — not the benchmark. Tie this to your SaaS customer acquisition cost efficiency model and the broader B2B marketing attribution stack to ensure pipeline quality, not just pipeline quantity.
| Win rate | Base coverage | With slippage (1.2x) | Quarter-start target |
| 15% | 6.7x | 8.0x | 9-10x |
| 20% | 5.0x | 6.0x | 6-7x |
| 25% | 4.0x | 4.8x | 5-6x |
| 30% | 3.3x | 4.0x | 4-5x |
| 40% | 2.5x | 3.0x | 3-4x |
Source: Only-B2B — Sales Pipeline Coverage Ratio; Gain.io — Pipeline Coverage Ratio Guide 2026; Apollo — What Is a Sales Pipeline 2026
The discipline ties to wider RevOps mechanics — see our lead scoring framework for upstream qualification quality and our marketing qualified lead definition for the MQL→SQL handoff that feeds the pipeline.
Pipeline velocity: the metric that beats coverage volume

Pipeline velocity is the single metric that determines whether your team will hit quota. The formula:
Pipeline Velocity = (Number of Qualified Opportunities × Average Deal Size × Win Rate) / Sales Cycle Length
Healthy mid-market B2B SaaS targeting $30k ACV with 25 qualified opportunities open, 25% win rate, and 75-day cycle generates: (25 × $30k × 0.25) / 75 = $2.5k/day = $225k/quarter. The four levers to increase velocity are visible in the formula — and three of them are more leverageable than "add more pipeline":
- Win rate — the highest-leverage lever. Lifting from 25% to 30% increases velocity 20%. Achieved through better qualification (MEDDIC discipline), tighter ICP focus, and stronger discovery.
- Cycle length — the second-highest. Compressing from 75 to 60 days lifts velocity 25%. Achieved through proactive next-step booking, contract pre-work, and AI-augmented deal-risk detection.
- Average deal size — modest leverage but compounds. Multi-product expansion in proposal stage, tier-up offers, multi-year discounts.
- Pipeline volume — the lazy lever. Adding 30% more deals to a flawed pipeline produces 30% more chaos. Address the other three levers first.
Reevo's 2026 pipeline metrics analysis shows top-quartile B2B SaaS programmes drive velocity 2-3x median through stage discipline alone — not pipeline volume increases.
The forecast cadence: weekly, monthly, quarterly

Forecast accuracy collapses without ritual. The 2026 cadence operates on three nested loops: weekly forecast call (deal-level inspection), monthly pipeline review (stage health), quarterly board forecast (revenue commitment). Each loop has documented inspection criteria, escalation paths, and decision authority.
Weekly forecast call (60 minutes, every Monday). AEs walk through Commit, Best Case, and Pipeline categories. Each Commit deal is inspected: economic buyer engaged in last 7 days, next step scheduled, contract draft in motion, no objections outstanding. Sales manager challenges any "verbal yes" without confirming evidence. Sandbagging in Best Case category exposed via deal-age and stage-conversion analysis.
Monthly pipeline review (90 minutes, end of month). Stage-by-stage health metrics: stage age distribution, conversion rate by stage, win rate trend, slippage rate. RevOps presents the dashboard; sales manager identifies bottleneck stages; CRO approves coaching capacity reallocation.
Quarterly board forecast (board prep window). Triangulated forecast: AE roll-up (Commit + Best Case), RevOps regression model (historical conversion × current pipeline), AI-augmented forecast (Clari/Gong-style predictive). Variance between methods triggers structured deep-dive. Pair the cadence with the broader sales automation infrastructure for the underlying CRM workflow layer.
The five failure modes that kill pipeline programmes
Failure mode 1: No documented stage exit criteria
Stages exist on the CRM but nobody can articulate what "moves" a deal forward. AEs advance deals based on optimism; pipeline becomes opinion. Document the exit criteria for every stage and enforce them in CRM workflow validation. Below 30% MQL→SQL conversion is almost always a stage-criteria failure.
Failure mode 2: Coverage ratio without velocity tracking
"We have 4x coverage" says nothing about whether deals are moving. A 4x ratio composed of 60% stage-stuck deals over 90 days old converts at 8%, not 25%. Track stage-age distribution alongside coverage and disqualify deals beyond 1.5x median stage age.
Failure mode 3: Sandbagging and happy ears
AEs hide deals in Best Case to protect against blown forecast (sandbagging) or mark Commit deals on AE optimism with no buyer evidence (happy ears). Both kill forecast accuracy. The fix is structured deal-inspection rituals where every Commit deal must produce documented evidence in the last 7 days; absence triggers automatic move to Best Case.
Failure mode 4: No lost-deal analysis cadence
Deals close-lost without structured post-mortem. Same patterns repeat across AEs, across quarters. Top-quartile programmes review 100% of lost deals weekly with reason codes and pattern detection — and feed findings back into qualification criteria, demo scripts, and competitive battle cards. The recycle motion ties to B2B lead nurturing for closed-lost re-engagement at the 90-day mark.
Failure mode 5: CRM as filing cabinet, not source of truth
Next steps not set, close dates set to "end of quarter," amounts inaccurate, stage transitions undated. Without baseline CRM hygiene, no pipeline analysis is meaningful. The 2026 minimum: every open deal has next-step + close-date + amount + stage-age field, validated weekly in the forecast call. AEs without 90% hygiene compliance get coaching not credit.
How AI changes pipeline management economics
AI integration in pipeline management is now production-grade across three layers. Conversation intelligence (Gong, Chorus) records and analyses every sales call, surfacing deal-risk signals that human pipeline reviews miss 60-70% of the time — no decision-maker on last call, pricing not discussed, next step not scheduled. Predictive deal scoring (Clari, Salesforce Einstein) augments the AE's gut-feel forecast category with model-derived close probability based on historical patterns. AI-driven forecast augmentation compares AE roll-up to model prediction and flags variance, producing a triangulated forecast with 80%+ accuracy in top-quartile teams vs 50-65% for human-only forecasts. Revenue intelligence platforms in 2026 compress the AE→manager→VP forecast review cycle from days to hours.
The economics: traditional pipeline management costs 0.5-1.0 FTE in RevOps overhead plus the time cost of inaccurate forecasting. AI-augmented pipeline drops the FTE to 0.25, lifts forecast accuracy 15-25 percentage points, and reclaims 4-6 hours per AE per week of manual CRM hygiene. For a 12-AE team, that's $250K-$400K of recovered selling capacity. Pair with broader agentic workflows and AI agent for sales patterns for compounding RevOps leverage.
The infrastructure spine: tooling, governance, ownership

Tooling stack. CRM-native pipeline management (HubSpot, Salesforce) covers 70%+ of mid-market B2B SaaS needs at $10M-$40M ARR. Layer revenue intelligence (Gong, Clari, Outreach) for conversation intelligence and forecast augmentation when team size exceeds 8 AEs or forecast accuracy stays below 70%. Gong vs Clari trade-off: Gong wins on conversation intelligence depth; Clari wins on forecast accuracy and revenue ops dashboards. The deeper architecture compounds with our CRM automation playbook.
Governance. RevOps owns pipeline definitions, stage criteria, and dashboard reporting. Sales leadership owns coaching capacity and forecast commitment. CFO/CRO own quarterly recalibration of stage definitions and coverage targets. Without RevOps ownership, definitions get pulled in two directions — marketing wants conversion-rate optics, sales wants flexible stage interpretation — and the programme decays.
Reporting cadence. AE-level: real-time CRM hygiene dashboard. Manager-level: weekly forecast pack. VP-level: monthly pipeline review with conversion-by-segment trend. C-suite: quarterly board forecast with regression model + AI augmentation. Each layer requires the layer below to be clean — broken data at AE level cascades up to broken board forecasts.
Want a diagnostic on where your pipeline is leaking velocity?
Book a Growth Mapping CallThe 90-day rollout playbook
For a $10M-$40M ARR mid-market SaaS rebuilding pipeline discipline from a chaotic state, the 90-day sequence:
Days 1-30: Audit, define, instrument
Audit current pipeline performance: conversion rate by stage, win rate, cycle length, forecast accuracy, CRM hygiene compliance. Document the six-stage architecture with explicit exit criteria signed off by sales leadership. Calculate required coverage from win rate. Instrument CRM with stage-age tracking and weekly hygiene scoring. Target deliverable: documented pipeline architecture + coverage formula + AE hygiene baseline.
Days 31-60: Install ritual cadence + AI augmentation
Launch weekly forecast call with documented inspection criteria. Deploy monthly pipeline review with stage health dashboard. Pilot conversation intelligence (Gong or equivalent) on top 4-6 AEs. Begin lost-deal post-mortem cadence. Switch primary KPI from pipeline volume to pipeline velocity. Target: 90%+ CRM hygiene, weekly forecast accuracy within 15% of actuals.
Days 61-90: Calibrate, escalate, board-ready
Run first quarterly recalibration: pull 90 days of stage conversion data, identify bottleneck stages, adjust coverage targets. Build the triangulated forecast (AE roll-up + RevOps regression + AI augmentation). Present first board-ready forecast pack with documented variance analysis. Document the recalibration playbook so the team can run it autonomously by Q2. Target: forecast accuracy within 10%, win rate +3-5pp, cycle length -10-20%.
Architect a sales pipeline that compounds revenue predictability
peppereffect installs the six-stage pipeline architecture for $10M-$40M ARR B2B SaaS leaders ready to stop missing forecasts. We deploy the stage-gate definitions, the coverage-ratio math, the weekly inspection rituals, and the AI-augmented forecast triangulation that turns pipeline from a hopeful dashboard into the board-defending discipline your CFO expects.
Book a Growth Mapping CallFrequently asked questions
What is sales pipeline management?
Sales pipeline management is the discipline of stewarding deals through documented stages with explicit exit criteria, monitoring stage health metrics, running forecast inspection rituals, and reallocating coaching capacity to the deals where AE intervention will move the needle. The 2026 architecture combines six stages, MEDDIC-aligned exit criteria, weighted coverage ratios, weekly forecast cadence, and AI-augmented predictive deal scoring.
What's a healthy pipeline coverage ratio for B2B SaaS?
3x to 5x is the standard benchmark, but the actual ratio you need is mathematically derived: required coverage = (1 / win rate) × slippage factor (typically 1.2x). With a 25% win rate, required coverage is 4.8x. Below 3x at quarter start correlates with forecast miss probability above 40%; above 6x without velocity discipline indicates stage-stuck deadwood.
What's the difference between sales pipeline and sales funnel?
Pipeline is sales-side: deals progressing through stages with explicit exit criteria, owned by AEs, measured in dollars and days-in-stage. Funnel is marketing-side: leads progressing through awareness/consideration/decision phases, owned by marketing, measured in conversion rates. Pipeline starts where funnel ends — at the SQL handoff.
How do I calculate pipeline velocity?
Pipeline velocity = (qualified opportunities × average deal size × win rate) / sales cycle length. Mid-market B2B SaaS at 25 opps × $30k × 0.25 ÷ 75 days = $2.5k/day. The four levers — opportunity volume, deal size, win rate, cycle length — are not equal. Cycle compression and win-rate improvement leverage 2-3x more revenue per percentage-point change than volume increase.
What's a good win rate for B2B SaaS?
Industry average sits at 25-30%. Top-quartile programmes reach 40%+. Win rate variance month-over-month indicates pipeline-discipline maturity: organisations with documented stage-gate criteria hold variance below 8%; teams without stage discipline see 15-25% variance and run perpetual forecast misses.
How long should a B2B SaaS sales cycle take?
Median B2B SaaS cycles sit at 60-90 days for mid-market deals ($10k-$50k ACV). Longer than 90 days correlates with stage-stuck patterns and forecast decay. Enterprise deals ($100k+ ACV) extend to 120-180 days. Cycles below 30 days typically indicate transactional or PLG motions rather than full B2B sales. The wider go-to-market context is documented in our B2B demand generation strategy playbook.
What pipeline tools work for mid-market B2B SaaS?
Three layers: CRM-native (HubSpot, Salesforce — covers 70%+ of needs), revenue intelligence (Gong for conversation intelligence, Clari for forecast accuracy and dashboards), and prospecting/sequencing (Outreach, Salesloft, Apollo). Layer revenue intelligence when team size exceeds 8 AEs or forecast accuracy stays below 70%. sales pipeline management software SaaS sales playbook product-led vs sales-led decision ACV uplift framework
Resources
- Only-B2B — Sales Pipeline Coverage Ratio: Formula, Benchmarks
- Gain.io — Pipeline Coverage Ratio Guide 2026
- Guideflow — 15 Best Revenue Intelligence Platforms 2026
- Oliv.ai — Gong vs Clari Real User Reviews
- Prospeo — Business Pipeline Definition Metrics 2026
- Reevo — 7 Sales Pipeline Metrics to Forecast Revenue 2026
- Apollo — What Is a Sales Pipeline 2026
- Leadfeeder — 10 Best AI Sales Tools 2026
- Getalai — Best AI Sales Tool 2026
- ALM Corp — 25 Best Lead Generation Tools 2025-2026
- Markets and Markets — BI Platforms for Sales Performance
- Disruptive Advertising — Top B2B SaaS Marketing Agencies 2026


