

Lead scoring is where most B2B SaaS marketing teams quietly waste their pipeline. Sarah Chen-style mid-market CEOs are sitting on rule-based models that sales rejected eighteen months ago, predictive systems nobody recalibrates, and "MQL" definitions so loose that 40-50% of qualified leads get binned by AEs on first touch. The fix is not another scoring tool. It is an architectural rebuild — a model that predicts revenue, decays cleanly, integrates intent data, and earns sales adoption because it actually allocates the right accounts to the right reps at the right time. This playbook walks the four-quadrant scoring architecture, the predictive vs rule-based ROI math, and the 90-day rollout for installing a model your AEs will actually use.
The peppereffect view
Lead scoring is not a marketing tool — it is the routing logic between marketing demand and sales capacity. Architect it as four converging signal quadrants (fit, behaviour, intent, decay), wire it into a sales-marketing SLA, recalibrate quarterly, and treat predictive ML as a re-ranking layer over an explainable rule base — not a black box you hand to AEs and hope they trust.
What lead scoring actually is in 2026
Lead scoring is the system that assigns a numeric or grade-based value to every lead in your CRM, ranking them by likelihood to convert and routing them accordingly. The 2018 version was demographic checkboxes and email opens summed into a pass/fail threshold. The 2026 version is a four-signal composite — fit, behaviour, intent, decay — fed into either a maintained rule engine or an ML model, with thresholds calibrated against actual win/loss data and re-ranked in real time as new signals arrive.
Three structural shifts have rewritten the discipline. First, intent data became table stakes. First-party engagement plus third-party intent (G2, Bombora, 6sense, Demandbase) now drives 2-3x higher accuracy than fit-only models in ABM contexts. Second, predictive models matured. AI lead scoring pushes accuracy from the 15-25% baseline of traditional rule-based models to 40-60% in 2026 production deployments. Third, the MQL→SQL definition gap closed. Marketing and sales now share scoring inputs, threshold ownership, and SLA accountability — or the model fails inside two quarters.
The compounding effect: when scoring is wired correctly, mid-market B2B SaaS teams report MQL→SQL conversion rates of 25-35% in the top quartile vs 13% median — a 2x performance gap that's almost entirely scoring architecture, not lead quality.
The "set and forget" trap
Models built once and never recalibrated decay 30-40% within six months. 60% of B2B SaaS organisations never retrain their scoring model after launch, which is why scoring programs get blamed for missed pipeline targets six quarters after they were the highest-ROI investment marketing made that year.
The four-quadrant scoring architecture
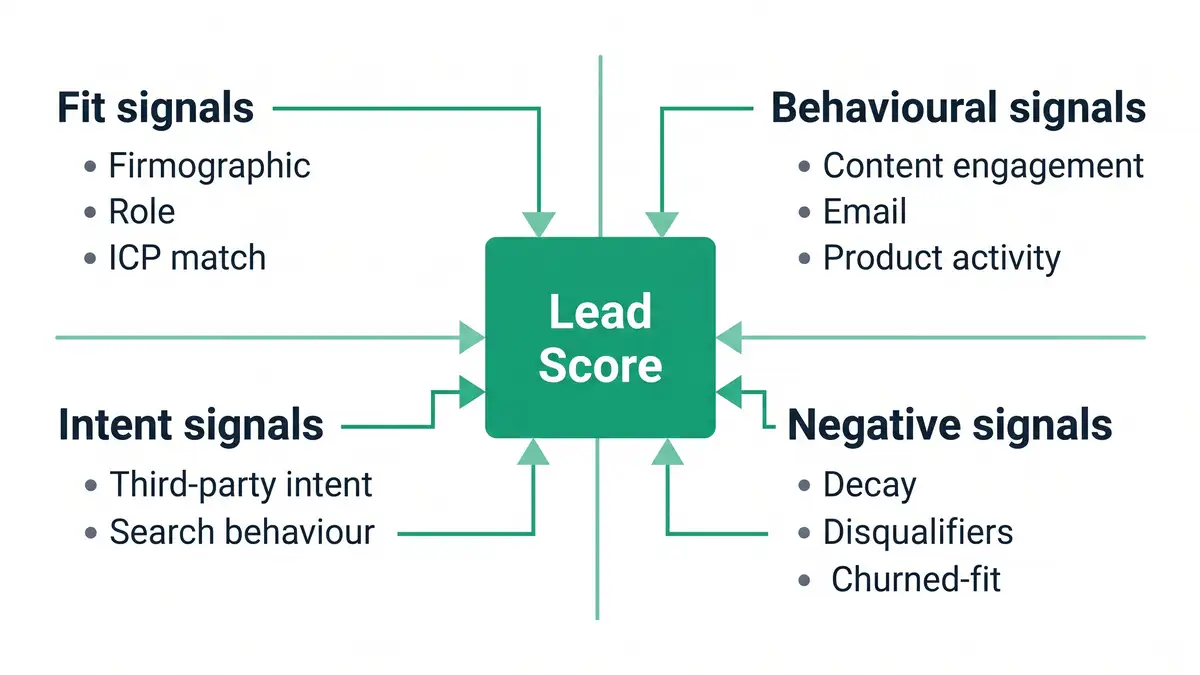
Every defensible scoring model in 2026 runs four signal quadrants in parallel. Each quadrant contributes weighted inputs to a composite score; thresholds at 60/75/90 produce A/B/C/D-grade tiers that map to sales actions.
Fit signals — firmographic and ICP match
Industry, company size, ARR, geography, role, seniority. The non-negotiable starting layer. Weight: 20-30% of composite. Below that weighting and you let irrelevant accounts hit AEs; above it and you ignore behavioural intent. Pull firmographics via Clearbit/ZoomInfo on form submit; never rely on self-reported form fields alone.
Behavioural signals — engagement depth and velocity
Content engagement (depth and recency), email click patterns, multi-session site behaviour, product activity (PLG signups, feature usage), webinar attendance. Modern high-performing models weight behavioural signals 35-45%. Velocity matters more than volume — three sessions in 48 hours beats fifteen sessions across six months.
Intent signals — third-party and search behaviour
Bombora, G2 buyer intent, 6sense, Demandbase, ZoomInfo intent feeds. The signal that converts ABM motion from "spray to target list" into "engage when buying window opens." Weight: 20-30% for accounts in your tier-1 list; 10-15% for inbound. Intent data without behavioural confirmation is noise; behavioural without intent is delayed.
Negative signals — decay and disqualifiers
Score decay (-2 points/week of inactivity after 30 days), explicit disqualifiers (student email, free email domain on enterprise tier, competitor at known account), churned-fit (past customers who churned for a fixable reason). Only 25% of organisations implement negative scoring; doing so improves model accuracy by 12-15%. Without it, lead scores drift upward into noise and sales loses trust. The decay logic compounds best when wired into behavioural email triggers so dormant leads get re-engaged before they churn out of the model entirely.
Predictive vs rule-based: when each one wins

The 2026 architectural debate has shifted from "should we use ML?" to "where in the model does ML actually earn its cost?" Pure rule-based models offer interpretability and immediate deployment but cap at 65-75% accuracy. Pure predictive ML models can hit 78-88% accuracy but need 5,000+ historical leads to train, take 8-12 months to deploy, and lose 20-30% of explainability — which translates directly into lower AE adoption.
The hybrid pattern wins for the $10M-$40M ARR cohort. Run a transparent rule-based base layer (fit + behavioural + simple intent thresholds) that AEs can read and trust, then layer a predictive ML re-ranker on top to surface non-obvious patterns within the top tier. AEs see the rule-based grade; marketing operations watches the ML re-rank for hidden signals. Both teams work from the same primary score with neither losing trust in the system.
| Dimension | Rule-based | Predictive (ML) | Hybrid (recommended) |
| Accuracy | 65-75% | 78-88% | 80-85% |
| Time to deploy | 4-6 weeks | 8-12 months | 6-10 weeks |
| Lead volume needed | Any | 5,000+ historical | 1,000+ historical |
| AE adoption rate | 85-90% | 60-70% | 80-85% |
| Annual maintenance | $5K-$15K | $30K-$100K+ | $15K-$40K |
| Best for | $1M-$10M ARR, low lead volume | $50M+ ARR, 10K+ leads/mo | $10M-$40M ARR mid-market |
Source: Warmly — AI Lead Scoring 2026; Business.com — Best Lead Scoring Tools 2026
The MQL→SQL conversion benchmark you should be hitting

The 2026 B2B SaaS funnel converges on stable benchmarks once scoring is wired correctly. Healthy MQL→SQL conversion sits in the 20-40% range with strict qualification; 13% is the median across loosely-defined programmes. The performance gap is almost entirely about scoring threshold calibration and the SLA between marketing and sales — not lead quality differences.
| Funnel stage | Median | Top quartile | Top decile |
| Visitor → Lead | 2.3-2.5% | 5-8% | 10%+ |
| Lead → MQL | 37-41% | 50%+ | 60%+ |
| MQL → SQL | 13-39% | 42-55% | 55%+ |
| SQL → Opportunity | 42-48% | 55%+ | 65%+ |
| Opportunity → Closed Won | 31-39% | 44%+ | 50%+ |
Source: PixelsWithin — B2B SaaS Conversion Benchmarks 2026; GrowthSpree — MQL to SQL Benchmarks 2026; Oliver Munro — SaaS Marketing Statistics 2026
If your MQL→SQL is below 20%, the problem is almost certainly threshold calibration — you are passing too many low-fit accounts to sales. If conversion is above 50% but volume is collapsing, you've over-tightened thresholds and starved AEs of pipeline. The corrective discipline is documented in our customer acquisition cost framework, the deeper SaaS CAC playbook, and the wider B2B lead generation architecture that surrounds the scoring layer. Pair scoring with a tight B2B lead nurturing programme to keep low-tier scores from flatlining out of the funnel.
The five failure modes that kill scoring programmes
Every lead scoring rebuild we audit fails on one of five structural patterns. None of them are technology problems. All of them are architecture and governance problems.
Failure mode 1: Marketing built it without sales in the room
Models architected by marketing in isolation get rejected by sales within 90 days. AE rejection rate above 30% on "MQL" leads is the leading indicator that thresholds were calibrated against MQL volume, not SQL conversion. The fix: every scoring rebuild starts with a sales-marketing SLA workshop — input weights, threshold definitions, and rejection-loop process all signed off before launch.
Failure mode 2: Demographic-only scoring
"VP at $50M+ company in our ICP" produces 25 leads a month at 12% conversion. The same firmographic filter combined with behavioural signals (3+ content engagements in 14 days) produces 18 leads at 38% conversion. Same fit; the behavioural signal is the conversion multiplier. Models that ignore behaviour are running 2018 logic against 2026 buyer journeys.
Failure mode 3: No negative scoring
Without decay or disqualifiers, lead scores drift upward forever. A lead that engaged six months ago with no recent activity is not a 78-point hot lead; it's a stale record clogging the queue. Implement -2 to -5 points per week of inactivity after 30 days. 75% of organisations skip this and wonder why their queue is full of zombies.
Failure mode 4: Black-box ML without explainability
"Trust the model" doesn't survive the first quarter where AEs miss quota. ML scoring without explanation tooling — feature importance, individual prediction reasons, threshold drift alerts — gets quietly bypassed. AEs build their own shadow scoring in spreadsheets and the central programme dies. Explainability is not optional; it is the AE adoption fuel.
Failure mode 5: Set-and-forget threshold management
Buyer behaviour shifts. Product positioning evolves. ICP refines. A model launched 18 months ago against a 2024 buyer journey is now mispredicting against a 2026 reality. Top-quartile programmes recalibrate quarterly with a documented review process; bottom-quartile programmes never recalibrate and watch accuracy decay 30-40% in six months.
How AI and agentic systems change scoring economics

Agentic AI is rewriting the cost-per-decision math beneath lead scoring. Where rule-based scoring requires manual rule maintenance and predictive ML requires retraining cadences, agentic systems re-score continuously as new signals arrive — autonomously adjusting thresholds, flagging model drift, and re-routing accounts whose intent surfaces shift mid-cycle.
Three high-leverage 2026 use cases are production-ready: autonomous re-ranking when third-party intent fires, dynamic threshold adjustment based on rolling 90-day win/loss data, and behavioural anomaly detection that flags accounts whose engagement pattern matches your top 5% closed-won historical cohort. The deeper mechanic is documented in our agentic workflows playbook and our AI agent for sales guide. Pair scoring agents with CRM automation to eliminate the manual rerouting AEs currently absorb.
The economics: traditional rule-based scoring costs $10K-$15K/year in maintenance for a mid-market team; predictive ML adds $30K-$60K in MLOps; agentic re-scoring layered on top adds $15K-$30K but reclaims 6-10 hours per AE per week of manual triage. For a 12-AE team, that's $180K-$300K of recovered selling capacity — comfortable 4-8x payback in year one.
The infrastructure spine: SLA, recalibration, and tooling
The four scoring quadrants only compound when wired into three governance layers.
The Sales-Marketing SLA. Document who owns each input weight, which threshold triggers AE assignment, the rejection-loop process when AEs disqualify, and the recalibration cadence. Top-quartile programmes update the SLA quarterly with both teams in the room; bottom-quartile programmes have a 2022 SLA pinned to a Confluence page nobody reads. The single highest-ROI scoring upgrade most marketing teams can ship is rewriting the SLA — see our complete B2B demand generation strategy framework for the wider context.
The recalibration cadence. Quarterly review minimum: pull last 90 days of MQL→SQL→Closed Won conversion data, segment by score tier and signal source, identify drift, recalibrate thresholds. Annual review: full model rebuild — re-evaluate signal weights, retire unused inputs, add new ones. Without recalibration cadence, models silently degrade. The recalibration discipline mirrors the sales automation review cadence — both are RevOps governance habits, not one-off projects.
The tooling stack. CRM-native scoring (HubSpot AI predictive, Salesforce Einstein) covers 70% of $10M-$40M ARR needs. Layer specialised tools (6sense, Demandbase, Warmly, Apollo) for intent and ABM accounts — these slot directly into the SaaS lead generation stack rather than replacing it. Specialised lead scoring platforms earn their cost only when integrated into the broader RevOps stack — standalone scoring tools without CRM/MAP integration are vanity software.
Want a diagnostic on where your scoring model is leaking pipeline?
Book a Growth Mapping CallThe 90-day rollout playbook

For a $10M-$40M ARR mid-market SaaS rebuilding scoring from a legacy state, the 90-day sequence:
Days 1-30: Audit, align, define
Audit current model performance: MQL→SQL conversion by score tier, AE rejection rate, signal coverage. Run the sales-marketing SLA workshop — define MQL, SQL, and SAL with both teams in the room. Map the four quadrants (fit, behaviour, intent, decay) to your specific ICP. Pick rule-based vs hybrid based on lead volume. Target deliverable: signed SLA + scoring spec document.
Days 31-60: Build, integrate, train
Build the model in CRM (HubSpot AI predictive or Salesforce Einstein). Integrate first-party data (Clearbit/ZoomInfo enrichment, product activity, content engagement). Layer third-party intent (6sense or Bombora) for tier-1 ABM accounts. Train AEs on score tiers and routing logic. Run model in shadow mode for 14 days — score everything, route nothing — to surface threshold issues before flipping live.
Days 61-90: Launch, monitor, calibrate
Flip routing live with weekly conversion review for first 30 days. Track AE rejection rate (target: under 20% for A/B-grade leads). At day 75, run the first quarterly recalibration: pull conversion data, identify drift, adjust thresholds. Document the recalibration playbook so the team can run it without RevOps oversight by quarter two. Target: MQL→SQL conversion lift of 8-15 percentage points by Day 90.
Architect a lead scoring model your sales team will actually use
peppereffect installs the four-quadrant lead scoring architecture for $10M-$40M ARR B2B SaaS leaders ready to decouple MQL volume from SQL pipeline contribution. We deploy the sales-marketing SLA, the predictive vs rule-based hybrid, the intent data integration, and the recalibration cadence that turns scoring from vanity metric into routing logic.
Book a Growth Mapping CallFrequently asked questions
What is lead scoring?
Lead scoring is the system that assigns numeric or grade-based values to leads in your CRM, ranking them by likelihood to convert and routing them to sales accordingly. Modern 2026 scoring runs four signal quadrants — fit (firmographic/ICP match), behaviour (engagement depth and velocity), intent (third-party signals), and decay (negative scoring) — feeding into either a maintained rule engine or a predictive ML model.
What's a good MQL to SQL conversion rate for B2B SaaS?
Median is 13%; top-quartile programmes hit 25-35%; top-decile reach 55%+. The gap between median and top-decile is almost entirely scoring threshold calibration and SLA discipline, not lead quality differences. Below 13% indicates the model is passing too many low-fit accounts; above 50% with collapsing volume indicates over-tightened thresholds.
Should I use predictive lead scoring or rule-based?
For $10M-$40M ARR mid-market B2B SaaS, run a hybrid: rule-based base layer for explainability and AE adoption, predictive ML re-ranker on top to surface non-obvious patterns. Pure rule-based caps at 65-75% accuracy; pure ML hits 78-88% but loses 20-30% interpretability and AE adoption. Hybrid achieves 80-85% accuracy with 80-85% AE adoption.
How often should I recalibrate my lead scoring model?
Quarterly minimum, with a full annual rebuild. Models that don't recalibrate decay 30-40% accuracy within six months. Top-quartile programmes pull 90-day MQL→SQL→Closed Won data each quarter, segment by score tier, identify drift, and adjust thresholds. Annual reviews retire unused signals and add new ones.
What signals should a lead scoring model use?
Four quadrants: fit (firmographic, role, ICP match — 20-30% weight), behavioural (engagement depth and velocity — 35-45%), intent (third-party signals like Bombora, G2, 6sense — 20-30%), and negative (decay, disqualifiers, churned-fit — 10-15%). Behavioural velocity matters more than volume; intent without behavioural confirmation is noise.
How does AI lead scoring compare to traditional?
Traditional rule-based scoring achieves 15-25% accuracy in real-world B2B environments. AI lead scoring pushes accuracy to 40-60% by integrating intent data, multi-touch behavioural patterns, and ML pattern recognition. The hybrid model — rule-based base layer + ML re-ranker — captures most of the AI gain while preserving the explainability that drives AE adoption.
What are the biggest lead scoring mistakes?
Five recurring failures: marketing builds the model without sales in the room (drives 30%+ AE rejection), demographic-only scoring (ignores behavioural conversion multiplier), no negative scoring (queues fill with zombies), black-box ML without explainability (AEs bypass it), and set-and-forget threshold management (30-40% accuracy decay in six months). All five are governance failures, not technology failures. marketing qualified lead W-shaped attribution playbook pipeline coverage ratio math HubSpot vs Salesforce vs Pipedrive evaluation documented sales playbook
Resources
- GrowthSpree — MQL to SQL Conversion Rate Benchmarks B2B SaaS 2026
- Warmly — AI Lead Scoring: Compound Score Method for B2B Sales 2026
- Business.com — The Best Lead Scoring Tools of 2026
- Monday.com — MQL vs SQL Difference Explained 2026
- Understory — MQL to SQL Conversion Rates B2B SaaS Benchmarks
- Cleverly — 10 Best Lead Scoring Tools for B2B Sales Teams 2026
- PixelsWithin — B2B SaaS Conversion Benchmarks 2026
- Oliver Munro — 60+ SaaS Marketing Statistics & Benchmarks 2026
- Prospeo — Best Lead Prioritization Software for B2B Teams 2026
- Martal — MQL vs SQL B2B Lead Qualification Guide 2026
- DemandWorks — Top B2B Lead Generation Trends of 2026
- ALM Corp — 25 Best Lead Generation Tools 2025-2026


