Most B2B SaaS customer health scores are decoration, not diagnostics. They look impressive on a dashboard, score 60% of accounts as "healthy," and somehow miss 40% of the customers who churn next quarter. That gap is not a feature engineering problem, it is a discipline problem: weights set by intuition, signals chosen by availability, and a "score" that nobody acts on. A customer health score built correctly is something different entirely. It is a regression-validated early-warning system that flags at-risk accounts 30 to 90 days ahead of contract risk, routes red-tier accounts into automated playbooks, and lifts net revenue retention by 8 to 15 percentage points within a year. It is the predictive layer that turns the broader customer success metrics framework into operational save-rate behaviour.
This guide installs that score for $10M-$40M ARR B2B SaaS (Sarah Chen persona). It covers the canonical 6-input composite formula, the regression-validation workflow that ships truth-correlated weights, the red/amber/green threshold logic that wires straight into CSM workflows, and the AI-augmented predictive layer that lifts accuracy from 70% rule-based to 80%+ with a hybrid ML model.
The vanity score vs the predictive score
Three failure modes recur in every $10M-$40M ARR B2B SaaS health-score audit we run: weights set in a workshop without regression validation, signals chosen because they are easy to capture rather than because they correlate with churn, and a score that lives in a dashboard but never triggers a CSM action. Programmes that fix all three lift their predictive accuracy from random-noise (50-60%) to top-quartile (80-85%) in a single quarter, and convert that accuracy into a measurable save-rate.
The line between vanity and predictive runs through one variable: regression validation. Bonview Press's 2026 churn ML evaluation tested Random Forest, logistic regression, gradient boosting, and SVM classifiers on B2B churn data, with Random Forest hitting 80.74% accuracy and 61.34% F1 on validated feature sets. The implication for B2B SaaS is direct: a properly weighted composite score, calibrated against actual churn outcomes from the trailing 12 months, will outperform any unvalidated rule-based score by 15 to 25 percentage points.
The Validation Test
Pull the last 24 months of accounts. For each one, capture (a) its health score 60 days before its contract end, and (b) whether it churned. Calculate the correlation. If the correlation is below 0.5, your score is decoration. If it is above 0.7, your score is predictive. Programmes that have never run this calibration are flying blind on the single variable that determines the entire investment.
The canonical 6-input composite formula
Best-in-class 2026 B2B SaaS health scores use 5 to 8 weighted inputs. Below 5 is too narrow to capture multivariate risk; above 8 dilutes signal and delays recalibration. The canonical mid-market structure is six inputs, each contributing a calibrated weight to a 0-100 composite.
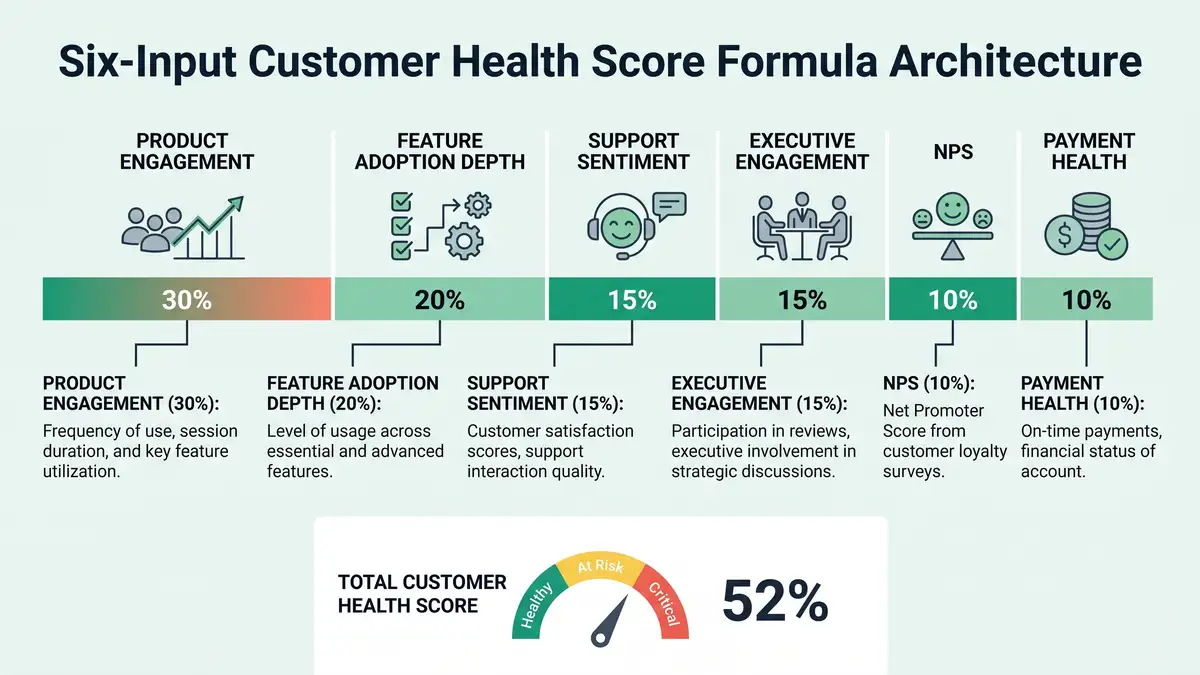
Input 1: Product Engagement (typical weight 30%)
Logins per active user per week, sessions per active week, time-on-product per session. HelloPM's PES research draws the right distinction: NPS measures what users say, Product Engagement Score measures what users do. PES is the single most predictive input on a B2B health score, which is why it carries the largest weight in nearly every regression-validated model.
Input 2: Feature Adoption Depth (typical weight 20%)
Number of distinct core features used per month, breadth of feature usage across the product. A user who logs in daily but only touches one feature is at greater long-term risk than one who logs in twice a week across five features. Depth predicts retention; surface frequency does not.
Input 3: Support Sentiment (typical weight 15%)
Ticket volume trend (rising vs falling), CSAT trend, response-to-resolution time, NLP-derived sentiment score on call transcripts. Modern CS platforms run ticket and call NLP automatically; Bland AI's 2026 NPS guidance explicitly notes that sentiment trend lines outperform single-point CSAT scores as churn predictors.
Input 4: Executive Engagement (typical weight 15%)
QBR attendance, executive email engagement, exec-level NPS, presence at customer-event activities. Champion change is a top-three driver of mid-market B2B churn (see our companion SaaS churn analysis); executive engagement is the leading indicator that catches it.
Input 5: NPS (typical weight 10%)
Net Promoter Score, weighted lower than most health-score programmes default to. NPS is a useful sentiment input but it is highly volatile, low-frequency, and self-reported. It earns 10% of the composite, not 30%. Programmes that anchor health on NPS produce dashboards that look reassuring while accounts churn underneath, the same trap diagnosed in our SaaS churn analysis playbook.
Input 6: Payment Health (typical weight 10%)
Days-late on invoices, card-on-file expiry status, dunning-stage exposure. Payment health is the operational input that separates voluntary churn risk from involuntary churn risk; including it as a signal lets the score route involuntary risk into a separate dunning recovery playbook rather than triggering a full CSM intervention, an operational discipline that compounds with CRM automation on the back end.

The regression-validated build methodology
Building a health score that scores correlated with churn is a 7-step diagnostic process, not a workshop. Skip any step and the output is decoration.
Pull a labeled outcome dataset
Last 24 months of accounts: features captured per account at month-3, month-6, and month-9 of tenure, plus the binary outcome (churned vs renewed at month-12 or contract end). The features are your candidate signals; the outcome is what the score must correlate with.
Run logistic regression for signal selection
Fit a logistic regression on the candidate signals against the binary churn outcome. Identify the 5-8 highest-correlation signals. Reject any signal with weak correlation (p > 0.05) - it adds noise without predictive value. Top-quartile programmes typically find 5-8 dominant signals; programmes that try to use 12+ signals usually have 4 doing the work and 8 adding noise.
Build the weighted composite formula
Translate regression coefficients into weights that sum to 100. The canonical mid-market structure (Product Engagement 30, Feature Adoption 20, Support Sentiment 15, Executive Engagement 15, NPS 10, Payment Health 10) is a strong starting point; adjust per your dataset. Standardise each input on a 0-100 scale before weighting.
Calibrate red/amber/green thresholds
Plot health score against actual churn rate by score band. The threshold where churn rate spikes is your red threshold; the threshold where churn rate flattens at baseline is your green threshold. Typical mid-market: Red <50, Amber 50-75, Green 75-100. The thresholds are dataset-specific, not industry-standard.
Wire thresholds into CSM workflows
Red accounts auto-route to executive-escalation playbook within 24 hours. Amber accounts surface in weekly CSM 1:1s with a structured intervention checklist. Green accounts get expansion outreach. A score that does not trigger an action is decoration; customer success automation closes that loop.
Layer an ML model for predictive lift
Pecan AI's 2026 ML comparison ranks Random Forest and gradient-boosted classifiers as best-in-class for B2B churn prediction. Train the ML model on the same labeled dataset, then ensemble it with the rule-based composite (typical 60/40 ML/rules blend). The hybrid lifts predictive accuracy from 70-75% (rules alone) to 80-85% (ensemble), the same architectural shift powering broader agentic workflows across the customer lifecycle.
Recalibrate quarterly
Customer behaviour drifts. Macro conditions, product releases, competitive landscape, and ICP shifts all change which signals correlate with churn. Top-decile programmes recalibrate weights quarterly; median programmes ship a score and never revisit it. Quarterly recalibration alone lifts predictive accuracy 8-12 percentage points over a 12-month period.


The 2026 health-score tooling stack
Tooling alone never delivered a predictive score; discipline does. But the right platform accelerates everything else. ChurnCost's 2026 platform comparison and Vendr's Vitally pricing data set the canonical stack for mid-market B2B SaaS.
| Tier | Platforms | Annual cost (1k accounts) | Best fit |
| SMB / scrappy | Custify, Planhat starter, native HubSpot | $5K-$15K | Under $10M ARR, <500 accounts |
| Mid-market | Vitally, ChurnZero, Totango | $15K-$40K | $10M-$40M ARR (Sarah Chen tier) |
| Enterprise | Gainsight, Catalyst | $60K-$100K+ | $50M+ ARR, 1k+ accounts, complex segmentation |
Sources: Vendr 2026, ChurnCost ChurnZero vs Gainsight, Accoil ChurnZero Alternatives, eWebinar 2026 CS Software.
For $10M-$40M ARR B2B SaaS, the canonical mid-market choice is Vitally or ChurnZero ($15K-$25K/year), wired to a behavioural analytics layer (Mixpanel, Amplitude, Heap) and a predictive ML layer (Pecan, native AI). Mid-market overspending on Gainsight at $60K-$100K+/year typically underutilises 60-70% of the feature set, which is the most expensive form of vanity health scoring.
Six failure patterns that destroy health-score programmes
Failure 1: Weights set in a workshop
Workshop-set weights are intuition, not regression. They feel right and predict nothing. Always validate against the trailing 24-month outcome dataset before shipping the score.
Failure 2: NPS as the dominant signal
NPS earns 10% of the composite, not 30%. Programmes that lean heavily on NPS chase response rates instead of accuracy and produce scores that look reassuring while accounts quietly leave.
Failure 3: Score lives in a dashboard, not a workflow
If red-tier accounts do not auto-route to an executive escalation playbook within 24 hours, the score is decoration. The economics of the entire programme depend on the action the score triggers, not the number it displays.
Failure 4: No quarterly recalibration
Customer behaviour drifts; the score must drift with it. Programmes that ship a score and never revisit it lose 8-12 percentage points of predictive accuracy per year. Quarterly recalibration is mandatory, not optional.
Failure 5: Signals chosen by availability
"We have NPS data, so let's use NPS" is the wrong starting point, the same anti-pattern flagged in lead scoring upstream. The right question is which signals correlate with actual churn outcomes. If a high-correlation signal is not currently captured, the discipline is to start capturing it, not to substitute a low-correlation alternative.
Failure 6: 12+ signals diluting predictive power
More signals does not mean more accuracy. Beyond 8 inputs, additional signals typically add noise that reduces composite predictive power. Top-quartile programmes use 5-8 inputs and recalibrate weights, not signal counts.
The 90-day install rollout
Here is how we install a regression-validated customer health score for B2B SaaS clients in a single quarter. The sequencing matters: building the ML layer before establishing rule-based discipline produces a confident model trained on noise.
Days 1-30: Diagnose and validate
Pull the trailing 24-month outcome dataset. Run logistic regression for signal selection. Identify the 5-8 highest-correlation signals. Build the weighted composite formula. Calibrate red/amber/green thresholds against observed churn rates. Output: a regression-validated score with a baseline correlation above 0.7 against historical churn.
Days 31-60: Wire workflows and instrument
Deploy the score in the CS platform (Vitally / ChurnZero / Custify). Wire red-tier accounts to executive-escalation playbooks. Surface amber-tier accounts in weekly CSM 1:1s. Connect green-tier accounts to expansion outreach as part of the broader expansion revenue strategy. Add the AI predictive layer (Pecan or native ML) for hybrid scoring.
Days 61-90: Validate and recalibrate
Compare predicted at-risk accounts (model output) against actual churn over 60 days. Refine weights. Document save rates by playbook. Set a quarterly recalibration cadence with a documented owner (typically the RevOps lead working with a CS analyst). The output is a programme, not a project.

Want a diagnostic on whether your customer health score is actually predictive, or just decoration?
What "good" looks like at 12 months
A B2B SaaS team that installs this architecture and recalibrates quarterly typically lands the following deltas:
- Predictive accuracy at 60-day horizon: 80-85% (vs 50-60% baseline).
- Save rate on amber/red accounts: 30-50% (vs 5-10% baseline reactive saves).
- Lead time on at-risk identification: 60-90 days (vs 14 days or "at renewal").
- Net revenue retention up 8-15 percentage points.
- Annual gross churn down 1.5-3 percentage points.
- QBR-driven expansion contribution: 25-35% of total expansion revenue.
- CS cost-to-serve under 8% of ARR (down from 12-15% baseline), restoring the SaaS unit economics that compound long-term valuation.
Those are not magic numbers. They are the natural compounding effect of measuring causally instead of descriptively, recalibrating against fresh data quarterly, and wiring the score directly into CSM workflows so it triggers action instead of opinion. Gainsight's 2026 CS Index reinforces this trend across the broader market: the difference between programmes hitting 120%+ NRR and programmes stuck at 95% NRR is almost entirely measurement discipline, not platform spend.
FAQ
What is a customer health score?
A customer health score is a composite numerical score (typically 0-100) that combines 5 to 8 weighted behavioural and engagement signals to predict whether an account will retain, expand, or churn. Best-in-class scores are regression-validated against trailing churn outcomes, recalibrated quarterly, and wired directly into CSM workflows so the score triggers automated action when it crosses red or amber thresholds.
How do you calculate a customer health score?
Pull a 24-month labeled dataset (account features at month-3/6/9 plus binary churn outcome). Run logistic regression to identify the 5-8 highest-correlation signals. Translate coefficients into weights summing to 100. Standardise each input on 0-100. Calibrate red/amber/green thresholds against observed churn rates. Layer in an ML model (Random Forest or gradient boosting) for hybrid predictive lift. Recalibrate quarterly.
What is a good customer health score?
Score values are dataset-specific (a "75" in one company's calibration is not directly comparable to "75" in another, see also our SaaS onboarding best practices for the activation thresholds that feed early health scores). The right benchmark is correlation accuracy: top-quartile B2B SaaS health scores achieve 80-85% predictive accuracy at 60-day horizons; median scores hit 60-70%. If your score has not been regression-validated against actual churn outcomes, the value is functionally meaningless.
What signals should be in a customer health score?
The canonical 6-input composite for mid-market B2B SaaS: Product Engagement 30%, Feature Adoption Depth 20%, Support Sentiment 15%, Executive Engagement 15%, NPS 10%, Payment Health 10%. Adjust weights per your regression validation. Avoid 12+ signal models, additional inputs typically dilute predictive power beyond 8 signals.
What is the difference between customer health score and NPS?
NPS is one input to a customer health score, not the score itself. NPS measures sentiment (what users say); the health score measures behaviour and outcome (what users do, what their account profile looks like). NPS is volatile, self-reported, and low-frequency. The composite health score is multivariate, behaviourally grounded, and continuously updated. NPS earns 10% of a well-built health composite, not 30%.
How accurate are customer health scores?
Modern hybrid scores (rule-based composite + ML ensemble) hit 80-85% predictive accuracy at 60-day horizons. Random Forest classifiers tested on B2B churn data hit 80.74% accuracy and 61.34% F1. Rule-based scores alone typically score 60-70% accuracy. The gap between vanity scores (50-60%) and best-in-class is almost entirely regression-validation discipline and quarterly recalibration.
How often should I recalibrate the health score?
Quarterly minimum. Customer behaviour drifts with macro conditions, product releases, competitive moves, and ICP shifts. Programmes that ship a score and never revisit lose 8-12 percentage points of predictive accuracy annually. Quarterly recalibration is a programme, not a project; assign a documented owner (typically RevOps lead working with a CS analyst).
Which platforms build customer health scores?
For under $10M ARR: Custify, Planhat starter, native HubSpot ($5K-$15K/year). For $10M-$40M ARR: Vitally, ChurnZero, Totango ($15K-$40K/year). For $50M+ ARR with multi-segment portfolios: Gainsight or Catalyst ($60K-$100K+/year). Mid-market overspending on Gainsight typically underutilises 60-70% of features. Tooling does not deliver a predictive score; discipline does.
Architect a customer health score that predicts retention, not decorates dashboards.
peppereffect installs regression-validated customer health score systems for $10M-$40M ARR B2B SaaS: the canonical 6-input composite, the ML predictive layer, the red-amber-green workflow routing that converts a number on a screen into a save-rate motion on the floor. Logic-gated execution, not retainer hours.
Book a Growth Mapping Call five-layer retention system AI ticket deflection enterprise QBR motion
Resources
- Bonview Press, Data-Driven Churn Prediction: Evaluating ML Models for B2B
- Pecan AI, Top ML Models for Predicting Customer Churn
- Fast Data Science, Predicting Customer Churn using Machine Learning and AI
- Vendr, Vitally Software Pricing & Plans 2026
- ChurnCost, ChurnZero vs Gainsight 2026
- Accoil, Best ChurnZero Alternatives with Pricing
- eWebinar, 4 Best Customer Success Software Platforms 2026
- HelloPM, Product Engagement Score (PES) Definition
- Product School, 12 Customer Engagement Metrics for Revenue Retention
- Bland AI, NPS Survey Best Practices 2026
- Gainsight, What Customer Success Teams Are Prioritizing in 2026
- Pendo, Best Churn Prediction Tools for SaaS Teams 2026
- CustomerScore, SaaS Churn Rate Benchmarks 2026
- HubSpot, Customer Health Score: Everything You Need to Know
- Optif, B2B SaaS NRR Benchmarks 939 Companies