

Most B2B SaaS teams are drowning in customer success data and starving for predictive signal. The dashboard tracks 47 KPIs, the QBR slides update every quarter, and yet the first warning that an account is in trouble usually arrives the day they refuse to renew. Customer success metrics are not a scoreboard. They are an early-warning system that, properly architected, predicts retention 30-90 days ahead — and they are the operational layer where the difference between 97% NRR and 130%+ NRR gets decided. They sit downstream of SaaS onboarding best practices and upstream of expansion revenue strategy — making them the load-bearing measurement layer of the entire post-sale spine.
This guide installs the measurement architecture that mid-market B2B SaaS ($10M-$40M ARR) needs in 2026: a four-tier framework separating leading from lagging signals, a customer health score formula that actually predicts churn, the benchmarks that distinguish median from top-decile, and the AI-augmented operating model that compresses cost-to-serve while expanding NRR.
Why most customer success scorecards fail
Three failure modes recur across every audit we run on $10M-$40M ARR B2B SaaS: too many lagging metrics, no leading-indicator structure, and zero discipline about which numbers actually predict retention versus which ones merely describe it.
Churn rate, NPS, and "customer health score" all sound like customer success metrics. Only one of those three is reliably predictive at the account level. HelloPM's customer health score guide draws the distinction sharply: churn is a lagging indicator that tells you what already happened, while a properly composite health score is a leading indicator that signals risk before it materialises. Programmes that report churn quarterly without instrumenting health weekly are flying blind on the variable that matters most.
The Predictive Test
For every customer success metric on your dashboard, ask: does this number tell me what happened, or does it tell me what is about to happen? If you cannot name three metrics that reliably warn you 30-60 days before an account churns, your measurement architecture is descriptive, not predictive — and you will continue to learn about lost accounts the day the renewal fails.
The four-tier customer success metric framework
The architecture that survives executive scrutiny separates metrics into four functional tiers. Each tier has a distinct job, distinct cadence, and distinct ownership. Mixing them into one dashboard is the single most common reporting failure.
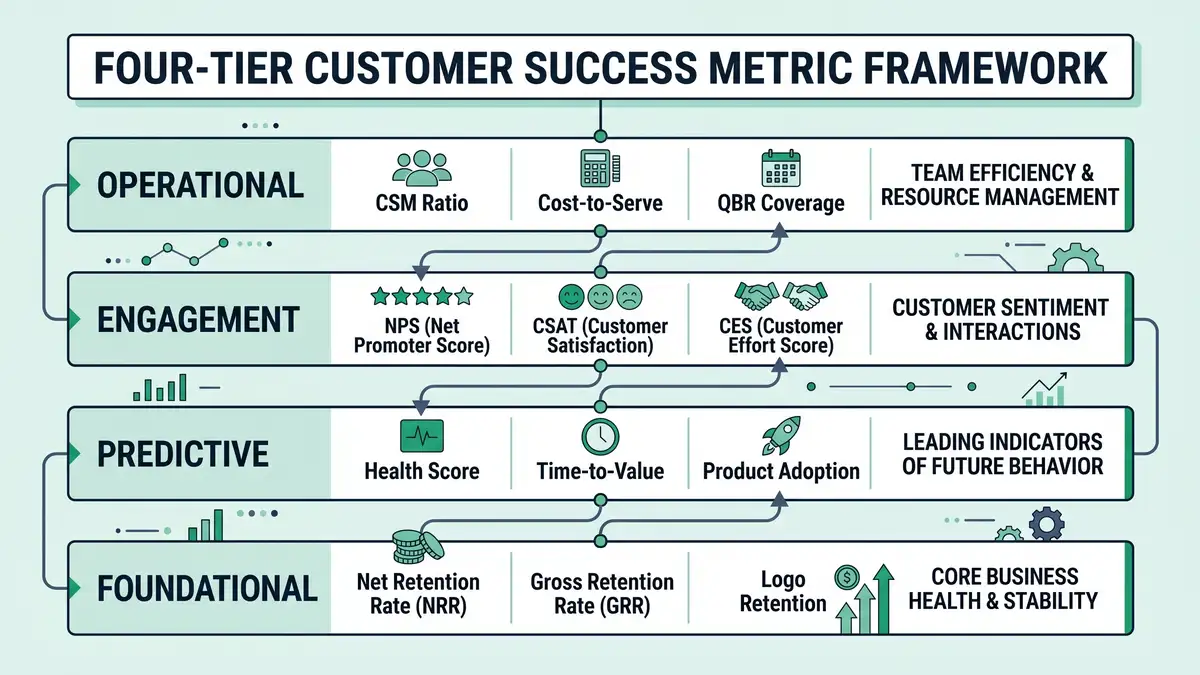
Tier 1: Foundational metrics (lagging, board-level)
Net Revenue Retention (NRR), Gross Revenue Retention (GRR), and Logo Retention. These are the lagging indicators that the board reads. They describe what already happened over the trailing 12 months. They cannot be improved this quarter — they can only be defended.
| Metric | Formula | 2026 Median | Top-Quartile |
| NRR (Enterprise, ACV $100K+) | (Starting MRR + expansion − contraction − churn) / Starting MRR | 118% | 130%+ |
| NRR (Mid-Market, ACV $25K-$100K) | Same | 108% | 120%+ |
| NRR (SMB, ACV <$25K) | Same | 97% | 110%+ |
| GRR (B2B SaaS) | (Starting MRR − contraction − churn) / Starting MRR | 85-95% | 92%+ |
| Logo Retention (annual) | Customers retained / Customers at start | 85-92% | 95%+ |
| Monthly Gross Revenue Churn | Lost MRR / Starting MRR | 1-2% | under 1% |
Sources: Optif 2026 NRR benchmarks, Averi 2026 metrics, T2D3 SaaS Recalibration, Swydo churn KPIs.
The structural insight: GRR is capped at 100% by definition because it excludes expansion. NRR can exceed 100% only when expansion outpaces churn. CRV's NRR explainer drives this home — a 130% NRR account base means existing customers grew 30% even before a single new logo was acquired. That is the engine of capital-efficient B2B SaaS, and it is the single best predictor of long-term valuation multiple — load-bearing inside SaaS unit economics and net revenue retention.

Tier 2: Predictive metrics (leading, weekly cadence)
Customer Health Score, Time-to-Value, Product Adoption Rate, Feature Engagement Depth. These are the early-warning signals that a CSM team operates on day-to-day. CustomerScore's 2026 benchmark finds that 70-80% of churning customers exhibit measurable warning signs at least 30 days before cancelling — every Tier 2 metric is engineered to surface those signs while there is still time to intervene.
The customer health score is the most misused metric in the entire framework. Built badly, it is a vanity number that correlates with nothing. Built well, it is a composite of 5-8 weighted signals that achieves 70-85% predictive accuracy on 60-day churn risk. HubSpot's health-score guide defines the canonical structure: usage frequency, feature breadth, support ticket sentiment, NPS, payment history, executive engagement, and contract milestones — each weighted by predictive contribution and recalibrated quarterly against actual churn outcomes.
Tier 3: Engagement metrics (sentiment, monthly cadence)
NPS, CSAT, CES. These measure how customers feel about the product and the relationship. They are useful but heavily over-weighted in most programmes. Nextiva's CES analysis argues that Customer Effort Score outperforms both CSAT and NPS as a churn predictor — because effort to get value is the most direct experiential variable a B2B buyer evaluates. Teneo's CES research reinforces this: low-effort interactions correlate with loyalty more reliably than high-NPS scores.
Tier 4: Operational metrics (efficiency, monthly cadence)
CSM-to-account ratio, cost-to-serve, QBR coverage rate, time-to-resolution. These are the unit economics of the customer success function itself. They tell you whether your CS organisation is scaling efficiently or simply absorbing more headcount as you grow. Guideflow's 2026 CS enablement guide is explicit that book sizes should adapt to ACV — typical 2026 ratios run 1 CSM per 8-15 enterprise accounts ($100K+), 1 per 30-60 mid-market ($25K-$100K), and 1 per 100-200 SMB (under $25K) on tech-touch programmes.
The customer health score formula that actually works
Most health scores in the wild are arithmetic averages of variables nobody validated. The 2026 best-practice formula is a weighted composite where each input is calibrated against a 12-month churn outcome dataset, recalibrated quarterly, and surfaced to CSMs through a single colour-coded dashboard.
Identify the churn outcome dataset
Pull the last 12-24 months of churned and retained accounts. For each account, capture pre-churn (or pre-renewal) values of every signal you have: login frequency, feature adoption, support tickets, NPS, CSAT, payment timeliness, executive engagement events, contract value, tenure, support sentiment.
Run logistic regression or correlation analysis
Identify which signals correlate most strongly with churn versus retention. Most teams find 5-8 dominant signals, with the top 2-3 carrying 60-70% of predictive weight. Reject signals with weak correlations — they add noise and dilute the score.
Build the weighted composite
Standard B2B SaaS structure: 30% product engagement (frequency + breadth), 20% feature adoption depth, 15% support sentiment (ticket count + CSAT trend), 15% executive engagement (QBR attendance + email engagement), 10% NPS, 10% payment health. Tune weights to your dataset.
Calibrate to a 0-100 scale and define risk tiers
Red (under 50): immediate CSM intervention. Amber (50-75): scheduled check-in within 14 days. Green (75-100): standard cadence. Set thresholds based on actual churn rates at each band — top-decile programmes recalibrate quarterly.
Wire into CSM workflows, not dashboards
A health score that nobody acts on is worse than no health score. Integrate the score into the CSM's daily task queue: red accounts auto-trigger playbooks, amber accounts surface in weekly 1:1s, green accounts get expansion outreach. Measure intervention success rate by tier.
Recalibrate quarterly against actual churn
The score that worked last quarter may not work this quarter. Re-run the regression every 90 days, adjust weights, retire signals that no longer predict, add new signals that emerge. Top-decile programmes treat the health score as a living model, not a static formula.
Layer in AI predictive accuracy uplift
2026 platforms (Gainsight's 2026 CS index, Vitally, ChurnZero, Totango) layer machine-learning churn prediction on top of rule-based health scores. The blended approach typically lifts predictive accuracy from 70-75% (rule-based) to 82-90% (rule + ML), and surfaces non-obvious risk patterns that human analysts miss — the same architectural shift powering customer success automation across the broader retention layer.


Six failure patterns that destroy CS measurement programmes
Every CS measurement audit surfaces the same handful of failure modes. Each is fixable, but only when named precisely.
Failure 1: NPS as the headline KPI
NPS is the most quoted and least predictive customer success metric in B2B SaaS. It correlates with sentiment, not retention. Programmes that anchor their CS dashboard on NPS spend disproportionate time chasing survey response rates while missing the product-engagement signals that actually predict churn.
Failure 2: Health score that nobody validated
The CSM team built a 12-input health score in a workshop, weighted each input by intuition, and shipped it. Six months later it scores 60% of accounts as healthy and 40% of churned accounts were in the "healthy" band. Without regression-validated weights, the score is decoration — and worse, it generates false confidence.
Failure 3: GRR not separated from NRR
The board sees 115% NRR and assumes retention is healthy. The underlying GRR is 82%. The 33-point spread is masking severe contraction and churn that expansion is plastering over. Top-decile reporting always shows GRR and NRR side-by-side, with explicit attribution to expansion, contraction, and gross churn.
Failure 4: CSM book size by tenure, not ACV
The senior CSM has 75 accounts because she's senior. Half are SMB tech-touch accounts that needed automation, not human time. Meanwhile two strategic enterprise accounts are starved of attention. Guideflow's 2026 enablement framework is explicit: book sizes must follow ACV tiers and engagement model, not seniority.
Failure 5: QBR theatre instead of QBR substance
Quarterly business reviews degrade into status-deck recitals. The CSM presents adoption percentages, the customer nods, nothing changes. Top-decile QBRs have a single output: a documented commitment from the customer about the next quarter's expansion or value milestone, plus a documented commitment from the vendor about the support to deliver it — the post-sale parallel to what the SaaS sales playbook codifies on the new-business side.
Failure 6: Cost-to-serve never measured
The CS function expands headcount linearly with customer count and nobody questions it. Programmes that don't track CSM-to-revenue ratio and cost-per-account quickly become a margin drag. Custify's 2026 CS market data shows top-decile programmes hold cost-to-serve below 8% of ARR while delivering 120%+ NRR.
The 2026 customer success tooling stack
2026 platforms split into three tiers by price and capability. Tooling alone does not deliver retention — discipline does — but the right stack accelerates everything else.
| Tier | Platforms | Annual cost (1k accounts) | Best fit |
| SMB / scrappy | Custify, Planhat starter, native HubSpot | $5K-$15K | Under $10M ARR, <500 accounts |
| Mid-market | Vitally, ChurnZero, Totango | $15K-$60K | $10M-$40M ARR (Sarah Chen tier) |
| Enterprise | Gainsight, Catalyst | $100K+ | $50M+ ARR, 1k+ accounts, complex segments |
Source: The CS Cafe — 2026 platform comparison, Vitally — CS automation 2025, TimeToReply — 11 AI CS tools 2026.
For a $10M-$40M ARR B2B SaaS, the canonical stack is Vitally or ChurnZero ($15K-$25K/year), wired to a behavioural analytics layer (Mixpanel/Amplitude) and a predictive churn model layered on top — the same instrumentation discipline that sales pipeline management requires upstream. Total stack cost: $40K-$80K/year for a 1,000-account portfolio. Programmes that overspend on Gainsight Enterprise at this stage typically end up underutilising 70% of the feature set.

Want a diagnostic on whether your customer success metrics actually predict retention — or just describe it?
The 90-day customer success measurement install
Here is how we install the four-tier framework for B2B SaaS clients in a single quarter. The sequencing matters — instrumenting predictive metrics before defining the activation event produces dashboards that measure the wrong thing.
Days 1-30: Diagnose and define
Audit the current scorecard. Map every metric to one of the four tiers. Identify gaps. Pull 12 months of churn data and run regression analysis to identify the 5-8 highest-correlation signals. Define the customer health score formula and risk thresholds. Output: a baseline scorecard, a validated health score formula, and a prioritised gap list.
Days 31-60: Instrument and integrate
Deploy the health score in the CS platform (Vitally / ChurnZero / etc.). Wire score thresholds to CSM workflows: red accounts auto-route to playbooks, amber accounts surface in weekly 1:1s. Restructure CSM book sizes by ACV tier. Re-design the QBR deck to lead with health score and expansion commitments, not adoption screenshots.
Days 61-90: Validate and scale
Compare predicted churn (from health score) against actual churn over 60 days. Refine weights. Layer in AI predictive scoring on top of rule-based composite. Document the scorecard playbook so the next quarterly recalibration follows the same diagnose → instrument → validate → adjust cycle. Customer success measurement is not a project — it is a programme.
What "good" looks like at 12 months
A B2B SaaS team that installs this measurement architecture and runs it disciplined for a full year typically lands the following deltas:
- NRR improvement of 8-15 percentage points (e.g., 105% to 115%+).
- GRR improvement of 3-7 percentage points (e.g., 87% to 92%+).
- Predicted-to-actual churn correlation above 80% (versus 50-60% baseline).
- Average lead time on at-risk identification: 60-90 days (versus 14 days or "at renewal").
- QBR-driven expansion contribution: 25-35% of total expansion revenue.
- CSM cost-to-serve: under 8% of ARR (down from 12-15% baseline).
- NPS still measured but no longer in the headline KPI list — replaced by health score and TTV. The compounding effect mirrors what lead scoring delivers on the acquisition side: discipline produces predictability.
Those deltas are not magic. They are the natural compounding of measuring the right thing, instrumenting it, and iterating against benchmark-grade data. Advocacy Maven's 2026 CS planning guide frames this shift sharply: customer success in 2026 stops being about health scores and starts being about engineered revenue outcomes — the same systemic logic underwriting agentic workflows across the entire B2B revenue spine.
FAQ
What are the most important customer success metrics?
The four-tier framework: Foundational (NRR, GRR, Logo Retention) for the board; Predictive (Customer Health Score, Time-to-Value, Product Adoption) for weekly CSM operations; Engagement (NPS, CSAT, CES) for monthly sentiment; Operational (CSM ratio, cost-to-serve, QBR coverage) for CS efficiency. NRR and Customer Health Score are the single most consequential metrics — one for board reporting, one for daily intervention.
What is a good NRR for B2B SaaS?
Median 2026 B2B SaaS NRR by ACV tier: Enterprise (ACV $100K+) 118%, Mid-Market ($25K-$100K) 108%, SMB (under $25K) 97%. Top-quartile companies clear 130% across all segments. Public-company top-decile NRR clears 140%+ (Snowflake, Datadog territory). The 2026 baseline is dragged down to 101-102% across private SaaS broadly, reflecting tighter buying environments.
What is a good Gross Revenue Retention rate?
Healthy GRR for B2B SaaS sits at 85-95%. Above 90% is target territory for mid-market and enterprise SaaS. Below 85% indicates serious product-market-fit or onboarding issues — diagnose against MQL definition rigour and activation discipline. GRR is mathematically capped at 100% because it excludes expansion — its job is to expose pure retention performance without the cosmetic effect of upsell.
How do you build a customer health score?
Pull 12-24 months of churn outcomes, run regression to identify 5-8 highest-correlation signals, build a weighted composite (typical structure: 30% product engagement, 20% feature adoption, 15% support sentiment, 15% executive engagement, 10% NPS, 10% payment health), calibrate to 0-100 with red/amber/green thresholds, wire into CSM workflows so red accounts auto-trigger playbooks, and recalibrate quarterly against actual churn.
Does NRR include new customers?
No. NRR measures revenue retention from a fixed starting customer cohort over a 12-month window — including expansion, contraction, and churn from that cohort, but excluding any revenue from net-new logos acquired during the period. New-logo revenue rolls into total ARR growth, not NRR. This is what makes NRR a clean retention signal independent of acquisition.
What is the difference between leading and lagging customer success metrics?
Lagging metrics (churn rate, NRR, GRR) describe what already happened — useful for board reporting, useless for intervention. Leading metrics (customer health score, time-to-value, product adoption, support ticket trends) signal what is about to happen — useful for daily CSM operations. Best-in-class programmes weight 60-70% of CSM attention on leading metrics and reserve lagging metrics for executive reporting.
What's a good CSM-to-account ratio?
Adapts to ACV tier in 2026: 1 CSM per 8-15 enterprise accounts (ACV $100K+), 1 per 30-60 mid-market accounts ($25K-$100K), 1 per 100-200 SMB accounts (under $25K) on tech-touch programmes. Programmes that ignore ACV stratification and assign by seniority typically over-serve SMB and under-serve enterprise — the opposite of capital-efficient deployment.
What customer success platforms should I use?
For under $10M ARR: Custify or Planhat starter or native HubSpot ($5K-$15K/year). For $10M-$40M ARR (mid-market sweet spot): Vitally or ChurnZero or Totango ($15K-$60K/year). For $50M+ ARR with complex multi-segment portfolios: Gainsight or Catalyst ($100K+/year). Mid-market teams overspending on Gainsight typically underutilise 70% of features and slow time-to-value on the platform itself. Match tooling to maturity, not aspiration — the same discipline that drives CRM automation ROI.
Architect customer success metrics that compound retention, not headcount.
peppereffect installs end-to-end customer success measurement systems for $10M-$40M ARR B2B SaaS — the four-tier framework, the regression-validated health score, the AI-augmented churn prediction, the operational ratios that decouple CS cost from revenue growth. Logic-gated execution, not retainer hours.
Book a Growth Mapping Call SaaS churn analysis methodology regression-validated customer health score B2B customer retention strategy customer support automation QBR framework
Resources
- Optif — B2B SaaS NRR Benchmarks (939 Companies by Segment & ACV)
- Averi — 15 Essential SaaS Metrics Every Founder Must Track in 2026
- T2D3 — The Great Recalibration: B2B SaaS Performance Metrics
- HubSpot — Customer Health Score Guide
- HelloPM — Customer Health Score: Meaning, Calculation, Examples
- CRV — What Is Net Revenue Retention (NRR)?
- CustomerScore — SaaS Churn Rate Benchmarks 2026
- CustomerGauge — Average Churn Rate by Industry (B2B Benchmarks)
- Swydo — Client Churn KPIs Every Marketing Agency Should Track
- The CS Cafe — Best Customer Success Platforms 2026
- Vitally — Best Customer Success Automation Software
- Gainsight — What CS Teams Are Prioritizing in 2026
- Guideflow — Customer Success Enablement: Complete Guide for 2026
- Nextiva — Customer Effort Score: Why It Matters
- Teneo — Customer Effort Score (CES) KPI
- Custify — 2026 Customer Success Industry Statistics
- Advocacy Maven — 2026 Customer Success: The Revenue Engine Shift
- TimeToReply — 11 Best AI Tools for Customer Success Management 2026


