Most B2B SaaS retention strategies are a list of tactics in search of a system. A QBR cadence here, a NPS survey there, a customer success manager hired in panic when a logo churns. The result is reactive customer service dressed up as retention strategy, and the economics show it: Net Revenue Retention stuck at 101 to 102%, churn drifting up, expansion revenue treated as a happy accident. A real B2B customer retention strategy is something different. It is a five-layer operating system that engineers retention into the customer lifecycle, not bolted onto it after the fact.
This guide installs that system for $10M-$40M ARR B2B SaaS (Sarah Chen persona). It covers the retention economics that justify the investment, the five operational layers that compound into measurable NRR lift, the AI-augmented retention motion that 2026 platforms enable, and the diagnostic framework that resolves where to invest first.
The retention economics that justify the architecture
Before the system, the case for the system. Umbrex's retention economics summary documents Bain's landmark research: a five-percentage-point lift in retention drives 25 to 95% profit improvement, almost entirely through retention compounding rather than cost reduction. Selling to an existing customer converts at 60 to 70%; selling to a new prospect converts at 5 to 20%. Acquiring a new customer costs 5 to 25 times more than retaining one. These are not new statistics, they are old statistics that B2B SaaS still routinely ignores in capital-allocation decisions.
The 2026 update to that classic logic is the NRR premium. Optif's NRR benchmarks across 939 companies show median Enterprise NRR at 118%, Mid-Market at 108%, SMB at 97%, with top-quartile clearing 130% across all segments. Breakthrough3x's retention guide reinforces the structural point: NRR above 110% is the single best predictor of capital-efficient B2B SaaS valuation, more predictive than growth rate alone.
The Retention ROI Test
For a $20M ARR SaaS at 100% NRR (flat retention), lifting NRR to 115% adds $3M in incremental ARR per year before any new customer acquisition. At a 5x revenue multiple, that is $15M in enterprise value created from the same customer base. Retention investment is not an expense to control, it is a capital-allocation decision with a measurable multiplier.
The five-layer retention system architecture
A retention strategy that scales beyond founder-led heroics requires five distinct operational layers, each with its own metrics, owners, and intervention playbooks. Skip one and the others compound less.
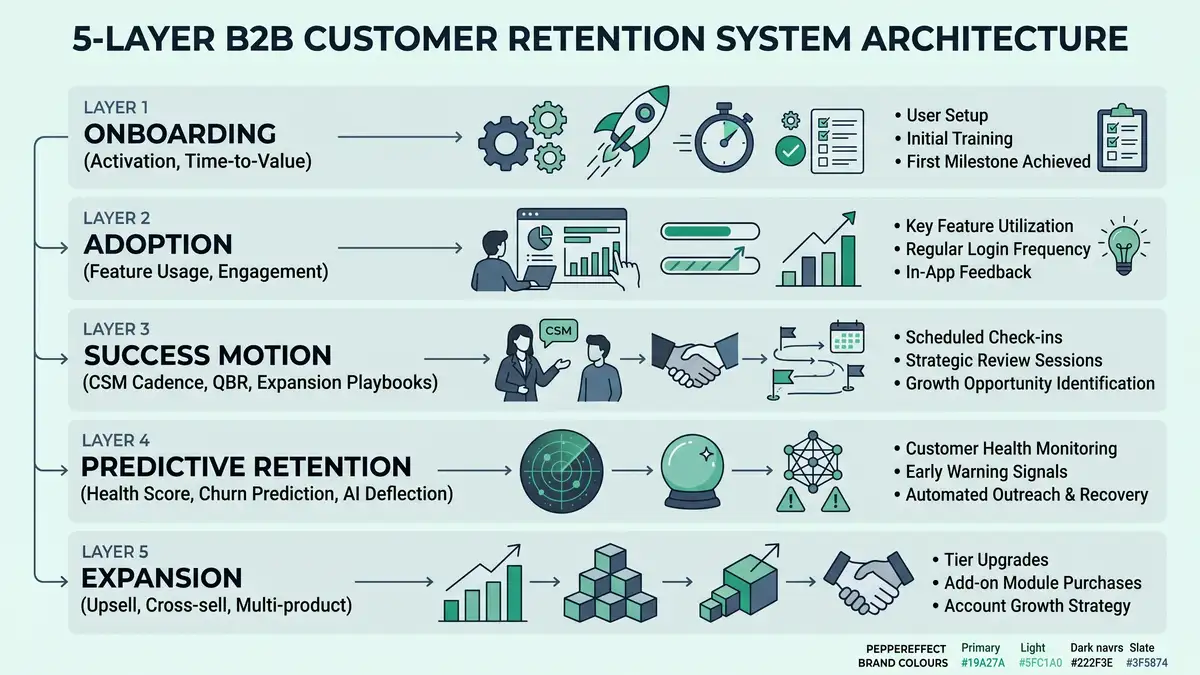
Layer 1: Onboarding (days 1-30)
Retention starts at signup, not at renewal. The first 90 days predict 60 to 80% of long-term retention, and the first 30 days inside that window do most of the work. SaaS onboarding best practices are the load-bearing layer of any serious retention architecture. Top-quartile B2B SaaS hits 25-40% activation rate within seven days; programmes below 15% activation will struggle to retain regardless of what happens downstream, which is why the customer success metrics framework places activation alongside NRR as a foundational measurement.
Layer 2: Adoption (days 30-180)
Activation gets a user to first value. Adoption gets the account to multi-feature, multi-user, daily-workflow embedment. The metric: feature adoption depth (number of distinct core features used per active user per month) and active-seats-per-account growth curve. Accounts that plateau at one feature, one user, are systematically more likely to churn at renewal than accounts that expand usage across the product surface, the same dynamic that SaaS churn analysis surfaces in cohort drop-off patterns.
Layer 3: Success Motion (continuous)
The CSM cadence, QBR rhythm, and expansion playbooks that turn passive customers into active expansion candidates. Custify's research documents that programmes with structured CS cadences see 8-15 percentage points higher NRR than those running ad-hoc relationship management. The discipline is tier-aligned: enterprise gets weekly touch + quarterly QBR, mid-market gets monthly touch + semi-annual QBR, SMB runs on customer success automation with exception escalation.
Layer 4: Predictive Retention (continuous)
The early-warning layer that flags at-risk accounts 30 to 90 days before they churn. Customer health scores, churn prediction models, and AI deflection. Vitally's 2026 AI churn-management guide documents the modern stack: AI-augmented at-risk identification, automated health scoring, predictive renewal scoring at 75-85% accuracy. Without this layer, intervention happens at the renewal call, which is too late.
Layer 5: Expansion (continuous)
The motion that converts retained accounts into expansion revenue (upsell, cross-sell, multi-product, seat expansion). Top-quartile B2B SaaS pulls 32-40% of total ARR from existing customers via expansion. Expansion revenue strategy turns the customer base into the most predictable growth engine in the portfolio, often outpacing new logo acquisition by 2 to 3x in capital efficiency, the load-bearing dynamic in SaaS unit economics.

The 2026 retention benchmark table
Without numbers, "high retention" is theatre. Here is what 2026 data actually says about healthy versus alarming B2B SaaS retention.
| Metric | Healthy | Top-Quartile | Alarming |
| NRR (Enterprise, ACV $100K+) | 110-120% | 130%+ | under 100% |
| NRR (Mid-Market, ACV $25K-$100K) | 105-115% | 120%+ | under 95% |
| NRR (SMB, ACV under $25K) | 95-105% | 110%+ | under 85% |
| GRR (B2B SaaS overall) | 85-95% | 92%+ | under 80% |
| Logo retention (annual) | 85-92% | 95%+ | under 80% |
| Annual customer churn (B2B) | 3-5% | under 3% | over 7% |
| Expansion revenue contribution | 20-30% of ARR | 32-40%+ | under 15% |
| Activation rate (first 7 days) | 15-25% | 25-40% | under 10% |
Sources: Optif 2026, Averi 2026, Genesys Growth 2026, ALM Corp / Recurly 2025, T2D3 2026.
The structurally important insight: NRR above GRR is not a fluke, it is the engineered output of an expansion motion compounding on top of a defended retention base. Programmes hitting 110%+ NRR are not lucky, they have built the five-layer architecture deliberately, the same systemic discipline that compounds agentic workflows across the broader revenue lifecycle.
The seven-step retention architecture install
A repeatable methodology for installing the system, derived from the operational patterns that distinguish top-decile retention programmes from median ones.
Define the activation event precisely
"A customer is activated when they ___" must be answerable in one sentence with a behavioural threshold (e.g., "3+ team members active in week 2 with at least 5 reports generated"). Vague activation criteria produce vague retention outcomes. The activation event drives every downstream metric.
Instrument the cohort retention curve
Plot retention by acquisition month over 24 months. Cliffs at month 1-3 indicate onboarding failure. Cliffs at month 6-9 indicate adoption failure. Cliffs at month 12+ indicate value-delivery or competitive failure. The cliff location diagnoses the layer to invest in first.
Build a regression-validated customer health score
Pull 24 months of churn outcomes, run logistic regression to identify the 5 to 8 highest-correlation signals, build a weighted composite that scores accounts 0-100. Top-quartile programmes hit 75-85% predictive accuracy at 60-day horizons. Wire red-tier accounts to executive escalation playbooks within 24 hours.
Tier the CS cadence by ACV
Enterprise (ACV $100K+): 1 CSM per 8-15 accounts, weekly touch, quarterly QBR with documented expansion commitment. Mid-market ($25K-$100K): 1 CSM per 30-60 accounts, monthly touch, semi-annual QBR. SMB (under $25K): 1 CSM per 100-200 accounts on tech-touch with exception escalation. Programmes that ignore tier alignment over-serve SMB and under-serve Enterprise, the opposite of capital-efficient deployment.
Wire the QBR cadence to expansion outcomes
Every QBR ends with a documented commitment from the customer about the next quarter's expansion or value milestone, plus a documented commitment from the vendor about the support to deliver it. QBRs that produce status-deck recitals without commitments are theatre, not motion. ChurnZero's CS revenue metrics reinforce the discipline: NRR + GRR + LTV:CAC + TTV are the four numbers that determine whether the QBR cadence is actually working.
Layer in AI-augmented retention
Vitally's renewal management AI guide documents the modern stack: AI-driven at-risk identification, automated playbook execution, personalised renewal communications. Hybrid rule + ML scoring lifts predictive accuracy from 70-75% (rules alone) to 80-85% (ensemble). The cost-per-resolution drops from $15-30 (human) to under $1 (AI deflection) for routine queries.
Recalibrate quarterly
Customer behaviour drifts with macro conditions, product releases, and competitive moves. Top-decile programmes recalibrate health-score weights, cohort thresholds, and intervention playbooks every 90 days. Programmes that ship a retention system and never revisit it lose 8-12 percentage points of effectiveness annually.
Six failure patterns that destroy retention programmes
Failure 1: Treating retention as a CSM problem
Retention is a product + service + pricing + fit problem. CSMs cannot save accounts that the product is failing, that onboarding never activated, or that were sold to the wrong ICP. Programmes that load all retention responsibility onto CS produce burned-out CSMs and unchanged churn.
Failure 2: NPS as the headline retention metric
NPS is sentiment, not behaviour. NPS correlates weakly with retention compared to product engagement, feature adoption, and executive engagement signals. Programmes that anchor on NPS chase response rates while accounts churn underneath.
Failure 3: No tier-aligned CS book sizes
The senior CSM has 75 accounts because she's senior, regardless of whether they're SMB tech-touch or strategic enterprise. Half are accounts that should be automated, the other half are starved of attention. Tier-align by ACV, not seniority.
Failure 4: Reactive retention motion
Intervention happens at the renewal call when the customer announces they're leaving. By then the deal is lost. The retention layer must surface at-risk signals 30 to 90 days ahead with documented intervention playbooks, or the entire investment is decoration.
Failure 5: GRR not separated from NRR in board reporting
The board sees 115% NRR and assumes retention is healthy. Underneath, GRR is 82%. The 33-point spread is masking severe contraction and churn that expansion is plastering over. Top-decile reporting always shows GRR and NRR side by side.
Failure 6: Expansion treated as a happy accident
Expansion revenue is engineered through QBR commitments, multi-product packaging, seat-expansion mechanics, and outcome-based pricing. Programmes that don't have a documented expansion playbook leave 30 to 50% of available expansion ARR on the table.
The 2026 retention tooling stack
Tooling does not produce retention, discipline does. But the right stack accelerates everything else.
| Tier | Platforms | Annual cost (1k accounts) | Best fit |
| SMB / scrappy | Custify, Planhat starter, native HubSpot | $5K-$15K | Under $10M ARR, <500 accounts |
| Mid-market | Vitally, ChurnZero, Totango | $15K-$40K | $10M-$40M ARR (Sarah Chen tier) |
| Enterprise | Gainsight, Catalyst | $60K-$100K+ | $50M+ ARR with multi-segment portfolios |
Sources: The CS Cafe 2026, Pendo Churn Tools 2026, Gainsight CS Index 2026.
The total cost for a $10M-$40M ARR B2B SaaS canonical stack runs $40K-$80K annually for behavioural analytics + CS platform + AI predictive layer + renewal automation. Parloa's CX ROI analysis documents the typical pattern: $200K invested in retention tooling and team enablement that retains $500K+ in revenue produces a 2.5x first-year ROI before compounding effects.

Want a diagnostic on whether your retention programme is actually compounding NRR or merely defending GRR?
The 90-day retention architecture install
Days 1-30: Diagnose and define
Audit current NRR/GRR/logo retention by ACV tier. Plot 24-month cohort retention curves to identify cliff locations. Pull 12 months of churn data for regression analysis. Define the activation event precisely. Output: baseline measurements, identified intervention layer, validated activation criteria.
Days 31-60: Architect and instrument
Build the regression-validated customer health score. Tier the CS book sizes by ACV. Wire red-tier accounts to executive escalation playbooks. Restructure the QBR cadence to demand documented expansion commitments. Layer in AI predictive scoring on top of rule-based composite.
Days 61-90: Validate and scale
Compare predicted at-risk accounts (model output) against actual outcomes over 60 days. Measure save-rate by intervention type. Document the canonical playbooks. Set quarterly recalibration cadence with documented owner. Output: a programme that recalibrates against fresh data quarterly, not a project that ships and stagnates.
What "good" looks like at 12 months
- NRR up 8-15 percentage points (e.g., 105% to 115%+).
- GRR up 3-7 percentage points (e.g., 87% to 92%+).
- Annual gross churn down 1.5-3 percentage points.
- Predictive churn accuracy 75-85% at 60-day horizon.
- Save rate on at-risk accounts: 25-40% (versus 5-10% baseline reactive saves).
- Lead time on at-risk identification: 60-90 days (vs 14 days or "at renewal").
- QBR-driven expansion contribution: 25-35% of total expansion revenue.
- CS cost-to-serve under 8% of ARR (down from 12-15% baseline).
Those deltas are the natural compounding of installing the five-layer architecture and recalibrating quarterly. Oliver Munro's 2026 SaaS statistics compilation reinforces the broader pattern: programmes with disciplined retention architecture compound NRR 8-15 points faster than those running tactical CS without the underlying system, and the gap widens annually as the discipline compounds.
FAQ
What is a B2B customer retention strategy?
A B2B customer retention strategy is the engineered system that retains and expands existing customer revenue across the lifecycle. It spans onboarding, adoption, success motion, predictive retention, and expansion as five integrated operational layers, each with metrics, owners, and intervention playbooks. Best-in-class strategies are regression-validated, recalibrated quarterly, and wired directly into CSM workflows so the system triggers action when at-risk signals appear.
What is a good B2B customer retention rate?
For 2026 B2B SaaS: healthy annual customer retention runs 95-97%, GRR 85-95%, NRR varies by ACV tier (Enterprise 110-120%, Mid-Market 105-115%, SMB 95-105%). Top-quartile programmes clear 130% NRR across all segments. Below 85% GRR or 95% NRR signals serious product-fit, onboarding, or success-motion failure.
How do you calculate customer retention rate?
Customer retention rate = ((Customers at end of period − new customers acquired during period) / Customers at start of period) × 100. For revenue-based calculation: GRR = (Starting MRR − contraction − churn) / Starting MRR; NRR = (Starting MRR + expansion − contraction − churn) / Starting MRR. Always segment by ACV tier and acquisition cohort, aggregate retention rates obscure the patterns that drive intervention.
Why is customer retention more important than acquisition?
Bain's landmark research shows a 5pp retention lift drives 25-95% profit improvement, primarily through compounding effects rather than cost reduction. Acquisition costs 5-25x more than retention. Existing customers convert at 60-70% versus 5-20% for new prospects. NRR above 110% is the single best predictor of capital-efficient SaaS valuation. Retention is not just cheaper than acquisition, it produces structurally higher returns.
What are the most important customer retention metrics?
Foundational (board-level): NRR, GRR, logo retention, annual churn rate. Predictive (operational): customer health score, time-to-value, feature adoption depth. Engagement (sentiment): NPS, CSAT, CES. Operational (efficiency): CSM-to-account ratio, cost-to-serve, QBR coverage. NRR and Customer Health Score are the two most consequential, one for board reporting, one for daily intervention.
How do you reduce customer churn?
Install the five-layer system: tighten onboarding to lift activation rate, instrument feature adoption depth, build regression-validated health scoring, tier CS cadence by ACV, demand expansion commitments at QBRs, layer in AI-augmented predictive scoring. Address voluntary churn through value reinforcement and involuntary churn (26% of B2B SaaS churn) through dunning recovery and card-updater APIs, the operational layer that CRM automation handles upstream.
How do AI tools help with customer retention?
Modern AI-augmented retention platforms (Vitally AI, ChurnZero AI, Pendo AI, Gainsight AI) lift predictive churn accuracy from 70-75% (rule-based) to 80-85% (hybrid ML ensemble). They automate at-risk account identification, generate personalised renewal communications, deflect routine support queries at $1/resolution versus $15-30/resolution for humans, and surface non-obvious risk patterns that human analysts miss. AI accelerates retention discipline, it does not replace it.
What is the ROI of customer retention investment?
Typical 12-month payback: $200K invested in CS tooling and team enablement returns $500K+ in retained revenue (2.5x first-year ROI). At a 5x revenue multiple, a 5pp NRR lift on $20M ARR creates $15M in enterprise value from the same customer base. Top-decile programmes hit 8-15pp NRR uplift within 12 months of installing the five-layer architecture, with compounding returns thereafter that anchor the broader expansion revenue strategy.
Architect a B2B customer retention strategy that compounds NRR, not just defends GRR.
peppereffect installs end-to-end retention operating systems for $10M-$40M ARR B2B SaaS: the five-layer architecture, the regression-validated health scoring, the tier-aligned CS motion, the QBR commitment cadence, the AI predictive scoring layer. Logic-gated execution, not retainer hours.
Book a Growth Mapping Call support automation architecture quarterly business reviews
Resources
- Umbrex, Retention Strategy & Economics (Bain landmark research)
- ChurnZero, The Five Customer Success Revenue Metrics That Matter
- Vitally, AI for Churn Management Practical Guide
- Vitally, How to Use AI in Your Renewal Management Process
- Oliver Munro, 60+ SaaS Marketing Statistics 2026
- Breakthrough3x, Ultimate Guide to B2B SaaS Customer Retention Strategies
- Custify, SaaS Retention Customer Success Subscription Growth
- Parloa, Customer Service ROI: How CX Leaders Measure & Improve
- Optif, B2B SaaS NRR Benchmarks 939 Companies
- Averi, 15 Essential SaaS Metrics 2026
- T2D3, Great Recalibration B2B SaaS Performance Metrics
- CustomerScore, SaaS Churn Rate Benchmarks 2026
- ALM Corp, SaaS Digital Marketing Strategy 2026 (Recurly Churn Report)
- Genesys Growth, B2B SaaS Churn Rates 33 Statistics
- Gainsight, What CS Teams Are Prioritizing in 2026
- Pendo, Best Churn Prediction Tools for SaaS Teams 2026
- The CS Cafe, Best Customer Success Platforms 2026
- HubSpot, Customer Health Score Guide