Most B2B SaaS roadmaps ship 30 to 50 features per year and watch 30 to 40% of them collect dust within 90 days. The product team built it. Marketing announced it. The release notes went out. And the feature is sitting at 4% adoption two quarters later, dragging down NRR, inflating support load, and burning roadmap capital. A real feature adoption strategy is the engineered fix, and the same discipline that anchors a SaaS support automation programme. Not a tooltip campaign, not a release-note rewrite. A four-stage operating system that compounds discovery, activation, habit formation, and mastery into measurable adoption depth, with a 90-day install plan and a tooling stack tuned to $10M to $40M ARR B2B SaaS (Sarah Chen).
This article installs that system. It covers the economics that justify the investment, the four-stage adoption funnel, the 2026 metric framework, the tooling stack, the seven-step methodology, and the failure patterns that destroy adoption programmes. The objective: convert the features customers are paying for into features customers actually use, and convert that usage into NRR.
The economics of feature adoption
Before the architecture, the case for the architecture. SaaSFactor's 2026 feature adoption analysis documents the structural pattern: B2B SaaS accounts using 5+ features per month retain at 92 to 96%, while accounts using only 1 to 2 features retain at 60 to 75%. Adoption depth is one of the highest-correlation predictors of churn risk and expansion potential, second only to executive engagement signals.
The NRR connection is even clearer. Optif's NRR benchmark study across 939 B2B SaaS companies shows median Enterprise NRR at 118%, Mid-Market at 108%, SMB at 97%, with top quartile clearing 130%. McKinsey's 2025 NRR Advantage research shows top-quartile B2B SaaS hits 113% NRR, growing 13% from the existing customer base alone. Averi's 2026 SaaS metrics benchmarks reinforce the structural point: companies with NRR over 100% grow 1.5 to 3x faster than peers and are valued at materially higher multiples. Feature adoption depth is the operating-level lever that produces those NRR numbers.
The Feature Adoption ROI Test
For a $20M ARR SaaS at 100% NRR (flat), lifting average feature adoption from 2.5 to 5.5 features per account drives an 8 to 12 point NRR lift through expansion, upsell, and reduced churn. That is $1.6M to $2.4M in incremental ARR per year on the same customer base. At a 5x revenue multiple, that is $8M to $12M in enterprise value, generated by features that already exist and are already paid for. Adoption is the highest-ROI lever in the post-sale operating system.
The four-stage feature adoption funnel
Most failed adoption fails at discovery, not at value. A defensible adoption system needs four sequenced stages, each with its own metric, owner, and intervention playbook.
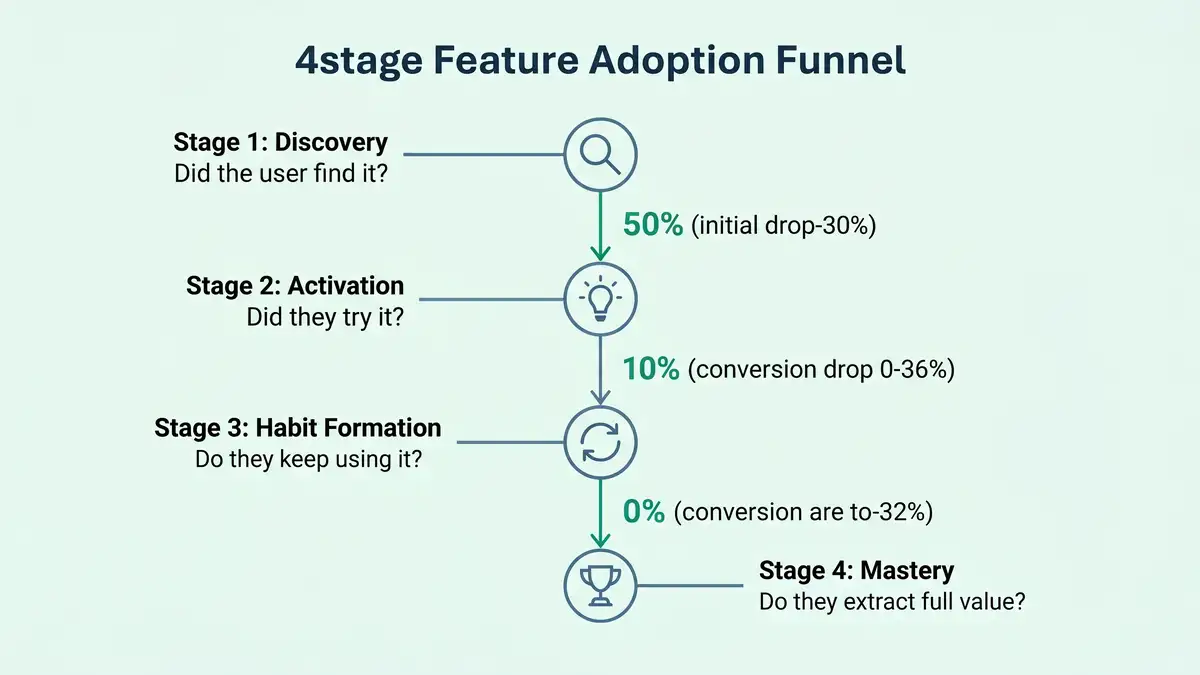
Stage 1: Discovery
Does the user know the feature exists? Most teams overestimate this radically. A customer logging in three times a week and never seeing a CTA, tooltip, or contextual prompt for a feature is functionally unaware of it. Discovery rate (% of MAU exposed to the feature in any 30-day window) is the front-of-funnel metric. Tools: Pendo guides, Userpilot tours, Appcues hotspots, in-app announcements, contextual banners.
Stage 2: Activation
Did they try the feature once? The conversion from discovery to first-use defines the front-end of the adoption pipeline. Healthy SaaS sees 25 to 40% activation from discovery; top-quartile clears 50%. Failure mode: discoverable but friction-heavy first-use experience that customers abandon.
Stage 3: Habit Formation
Did they come back? Single-use is not adoption. The metric: feature stickiness, defined as DAU/MAU per feature, or the percentage of activated users still using the feature in week 4. Below 30% week-4 retention on a feature signals weak product-feature fit or insufficient value delivery, not insufficient marketing.
Stage 4: Mastery
Are they extracting full value? Adoption depth measures the percentage of feature capability the account is using at month 6. Mastery shows up in expansion conversations: customers who hit mastery on the core feature set are 3 to 5x more likely to upgrade tier or add seats, the dynamic that agentic workflows compound across the broader operations stack. Mastery is the layer that turns feature adoption into NRR uplift.

The 2026 feature adoption benchmark table
Without numbers, "good adoption" is a feeling. Here is what 2026 data actually says about healthy versus alarming feature adoption in B2B SaaS, drawn from the validated sources cited throughout.
| Metric | Healthy | Top-Quartile | Alarming |
| Feature adoption rate (per launched feature, 90 days) | 20-35% | 40%+ | under 10% |
| Discovery rate (% of MAU exposed in 30 days) | 50-70% | 80%+ | under 30% |
| Activation rate (% of discoverers who try) | 25-40% | 50%+ | under 15% |
| Week-4 stickiness (% still using) | 40-55% | 60%+ | under 25% |
| Adoption depth (avg features per active account) | 3-5 | 5+ | under 2 |
| DAU/MAU stickiness (overall product) | 20-35% | 40%+ | under 15% |
| Time-to-first-value (per launched feature) | under 10 days | under 5 days | over 30 days |
| Feature breadth (% of features with >10% MAU) | 60-75% | 80%+ | under 40% |
Sources: SaaSFactor 2026, Pendo Product Analytics 2026, Userpilot Feature Adoption Rate 2026, Heap Feature Adoption.
The structural insight: top-quartile programmes drive feature breadth above 80% (most features have more than 10% MAU usage) not by building fewer features, but by engineering the four-stage adoption funnel for every meaningful feature shipped. This is the discipline that SaaS onboarding best practices and customer success metrics both depend on.

The 2026 feature adoption tooling stack
Tooling does not produce adoption, the four-stage funnel does. But the right stack accelerates everything. Below is the canonical 2026 stack for $10M to $40M ARR B2B SaaS, sourced from Pendo's 2026 Product Analytics Comparison, Pendo's 2026 In-App Guidance Tools Comparison, and Accoil's 2026 Pendo Alternatives Pricing Analysis.
| Tier | Core stack | Annual cost | Best fit |
| SMB / scrappy ($1M-$10M ARR) | Mixpanel (analytics) + Userpilot (in-app) | $8K-$25K | Under $10M ARR, <500 accounts |
| Mid-market ($10M-$40M ARR, Sarah Chen tier) | Pendo (analytics + in-app combined) OR Amplitude + Appcues | $25K-$80K | $10M-$40M ARR, 500-3,000 accounts |
| Enterprise ($50M+ ARR) | Amplitude Enterprise + WalkMe (DAP) + Heap autocapture | $120K-$300K+ | Multi-product, multi-segment |
Sources: Pendo Pricing, Mixpanel Pricing, Amplitude Pricing, Userpilot Pricing, Appcues Pricing, WalkMe DAP.
The total cost for a $10M to $40M ARR B2B SaaS canonical stack runs $25K to $80K annually. Compared to the multi-million-dollar NRR uplift documented above, the unit economics are obvious. ParallelHQ's 2026 Pendo guide reinforces the point: choose the stack that matches your scale, not the one your VC's portfolio company uses.
The seven-step feature adoption install
A repeatable methodology, derived from the operational patterns that distinguish top-decile feature adoption programmes from average ones.
Audit current feature adoption depth
Pull 90 days of product telemetry. For every feature, calculate: % of MAU using it, average sessions per user, week-4 stickiness, breadth across account size segments. Identify the bottom quartile (under 5% MAU usage) and the dark-matter features that nobody touches. The audit is the foundation. You cannot improve what you have not measured.
Define the activation event for each feature
"This feature is activated when the user ___" must be a behavioural threshold, not a marketing slogan. For a Slack-style integration: "user has connected at least one channel and sent 3+ messages." For a reporting feature: "user has built and saved a dashboard." Activation events drive every downstream metric.
Build the discovery layer first
For the bottom-quartile features, design contextual in-app prompts (tooltips, banners, hotspots) that surface the feature in the user's natural workflow. Test discovery rate before optimizing activation. Pendo's 2026 in-app guidance research documents typical 20 to 40% adoption uplift from contextual discovery prompts alone.
Engineer first-use friction reduction
Every feature has a first-use sequence. Audit each step: does the user need a sample dataset? A pre-filled template? A 60-second walkthrough? Top-decile adoption programmes obsess over the first 90 seconds of feature use. Userpilot's 2026 adoption rate research shows that a 30-second reduction in time-to-first-value lifts activation 15 to 25 percentage points.
Wire CSM and PMM playbooks to adoption signals
For tier-1 enterprise accounts, route low-adoption features into the QBR agenda. For mid-market, automate quarterly "feature adoption reviews" with personalised email recommending under-used features tied to the customer's documented goals. Customer health scores should weight feature adoption depth as a top-3 input variable.
Treat feature launches as marketing campaigns
The "ship-and-pray" launch is dead. Top-decile programmes run 4-week launch campaigns: in-app announcements, email sequences, webinar/demo, customer story, sales-enablement deck. Lenny's product launch playbook documents the canonical structure. Without launch-as-campaign discipline, the top-of-funnel discovery layer collapses.
Recalibrate quarterly
Adoption metrics drift with releases, segment mix, and competitive moves. Top-decile programmes review the funnel quarterly, retire features in the bottom 5% with no growth trajectory, double down on features in the top quartile, and refresh the discovery and activation layer for the rest. Reforge's adoption-loops framework is the canonical recalibration model.


Six failure patterns that destroy feature adoption
Failure 1: Confusing release notes for an adoption strategy
A blog post and an email blast at launch are the bare minimum. Without an in-app discovery layer, contextual activation prompts, and a CSM follow-up playbook, the feature dies in the noise. Most "we have an adoption problem" diagnoses are actually "we have a discovery problem."
Failure 2: No usage telemetry per feature
Teams that cannot answer "what is the 30-day MAU on Feature X" cannot manage adoption. Adoption is a measurement discipline first, an intervention discipline second. Without telemetry, every adoption conversation is opinion-based.
Failure 3: Optimizing for activation, ignoring habit formation
A feature that 60% of users try once and 5% use weekly is broken, not adopted. Stickiness (week-4 retention per feature) is the metric that distinguishes durable adoption from launch-week noise. Top-decile programmes anchor on stickiness, not on activation rate.
Failure 4: Building features customers don't ask for
The "feature factory" anti-pattern. When the roadmap is driven by sales objections, competitive parity, or executive whim rather than customer voice, adoption rates collapse. Top-decile programmes ship 30% fewer features and adopt them 3x harder, the same discipline embedded in customer success automation.
Failure 5: No connection to CSM and expansion motion
Adoption data that lives only in the product analytics tool is wasted. The data must feed CSM workflows, QBR agendas, expansion playbooks, and renewal conversations. Directive's 2026 B2B SaaS playbook reinforces this: NRR is the single most important metric, and adoption is the highest-leverage input.
Failure 6: Hiding from the dark-matter features
Some features will never adopt at scale. Pretending otherwise burns roadmap capital. Top-decile programmes have an explicit deprecation playbook: bottom 5% of features with no growth trajectory after 12 months are sunset, with the engineering capacity reallocated to feature breadth or adoption depth investments.
The 90-day install plan
Days 1-30: Audit and instrument
Audit current adoption depth across all features. Tag the bottom quartile and the dark-matter set. Define activation events for the top 10 strategic features. Stand up the analytics tool (Pendo, Mixpanel, Amplitude, or Heap depending on tier). Output: complete feature adoption baseline, activation events defined, telemetry live.
Days 31-60: Discovery and activation
Deploy in-app guidance (Userpilot, Appcues, or Pendo guides) for the bottom 5 features in the strategic set. Run 4-week A/B against control. Engineer first-use friction reductions. Output: discovery rate up 30 to 50 percentage points on bottom-quartile features, activation rate up 10 to 20 points.
Days 61-90: Wire CSM motion and recalibrate
Route adoption signals into health scoring, QBR templates, expansion playbooks. Stand up quarterly recalibration cadence with documented owner. Treat the next product launch as a 4-week marketing campaign. Output: adoption integrated with CSM motion, recalibration cadence in place, next launch campaign ready.
What "good" looks like at 12 months
- Average feature adoption depth: 5+ features per active account (vs 2.5 baseline).
- Feature breadth: 80%+ of features have over 10% MAU usage (vs 40 to 60% baseline).
- Discovery rate: 80%+ of MAU exposed to bottom-quartile features within 30 days.
- Time-to-first-value (per feature launch): under 5 days (vs 30+ baseline).
- Adoption-driven NRR uplift: 8 to 12 percentage points (e.g., 102% to 112%).
- Reduction in roadmap waste: bottom 5% deprecated annually, capacity reallocated.
- CSM cycle time: 30%+ reduction in time spent on routine adoption check-ins (automated playbooks).
- Feature launch impact: 40%+ adoption rate per launched feature (vs 10 to 20% baseline).
Those deltas are the natural compounding of installing the four-stage funnel and recalibrating quarterly. The discipline reinforces the broader retention architecture: B2B customer retention strategy compounds when adoption depth feeds NRR, SaaS churn analysis uses adoption signals as leading indicators, and expansion revenue strategy draws directly on mastery-stage accounts.
Want a diagnostic on whether your feature adoption is compounding NRR or just inflating activity reports?
FAQ
What is a feature adoption strategy?
A feature adoption strategy is the engineered system that drives customers to discover, activate, habitually use, and master the features they are paying for. It spans four sequenced stages with their own metrics, owners, and intervention playbooks: Discovery (does the user know it exists?), Activation (do they try it?), Habit Formation (do they keep using it?), Mastery (do they extract full value?). Best-in-class B2B SaaS programmes hit 5+ features per active account and tie adoption depth directly to NRR uplift.
What is a good feature adoption rate?
For 2026 B2B SaaS: healthy feature adoption runs 20 to 35% per launched feature within 90 days, top quartile clears 40%+, alarming is under 10%. Feature breadth (% of all features with over 10% MAU) should run 60 to 75% in healthy programmes and 80%+ at top quartile. Adoption depth (avg features per active account) of 3 to 5 is healthy, 5+ is top-quartile and strongly correlated with NRR over 110%.
How do you increase feature adoption?
Install the four-stage funnel: build the discovery layer with in-app guidance (Pendo, Userpilot, Appcues), engineer first-use friction reduction (templates, sample data, 60-second walkthroughs), measure habit formation via week-4 stickiness, route mastery signals into CSM and expansion motion. Treat every launch as a 4-week marketing campaign. Top-decile programmes lift adoption 30 to 50 percentage points within 90 days using this playbook.
How do you measure feature adoption?
Core metrics: feature adoption rate (% of MAU using the feature in 30 days), discovery rate (% of MAU exposed), activation rate (% of discoverers who try), week-4 stickiness (% still using after 4 weeks), adoption depth (avg features per active account), feature breadth (% of features with over 10% MAU), time-to-first-value (per launched feature), DAU/MAU stickiness. Tools: Pendo, Mixpanel, Amplitude, Heap, Userpilot for analytics; in-app guidance tools for activation.
What's the difference between feature adoption and product adoption?
Product adoption is the macro metric: did the customer adopt the product overall (active seats, activation rate at signup, DAU/MAU, retention curve). Feature adoption is the micro metric: did the customer adopt each meaningful feature within the product. Both matter. Product adoption gates initial activation. Feature adoption gates expansion, NRR, and long-term retention.
What tools do you need for feature adoption?
For $10M to $40M ARR B2B SaaS: Pendo (analytics + in-app combined, $25K to $80K/year) OR Amplitude + Appcues stack ($30K to $80K/year). Smaller orgs use Mixpanel + Userpilot ($8K to $25K). Enterprise uses Amplitude + WalkMe + Heap ($120K to $300K+). The choice depends on data volume, in-app guidance complexity, and existing analytics stack. Tooling does not produce adoption, the four-stage funnel does.
How does feature adoption affect NRR?
Feature adoption depth is one of the highest-correlation predictors of NRR. Accounts using 5+ features retain at 92 to 96% and expand at 1.3 to 2x the rate of accounts using 1 to 2 features. McKinsey's 2025 NRR research shows top-quartile B2B SaaS hits 113% NRR, with adoption depth as a top-3 driver. A typical 8 to 12 point NRR lift from disciplined feature adoption work translates to 1.6 to 2.4M ARR on a $20M base, or 8 to 12M in enterprise value at a 5x multiple.
What is the ROI of feature adoption investment?
Typical 12-month payback: $40K to $100K invested in tooling and team enablement returns 8 to 12 percentage points of NRR lift, equivalent to $1.6M to $2.4M in incremental ARR on a $20M base. At 5x revenue multiples, that's $8M to $12M in enterprise value created from features that already exist. The secondary effect (reduced roadmap waste, CSM productivity, support load reduction) typically adds another 30 to 50% on top of the headline NRR gain.
Architect a feature adoption strategy that compounds NRR, not one that ships features into the void.
peppereffect installs end-to-end feature adoption operating systems for $10M to $40M ARR B2B SaaS: the four-stage funnel, the in-app guidance layer, the activation engineering, the CSM playbook integration, the recalibration cadence. Logic-gated execution, not retainer hours.
Resources
- SaaSFactor, How to Measure Feature Adoption in SaaS
- Pendo, Top 10 Product Analytics Tools 2026
- Pendo, 8 Best In-App Guidance Tools 2026
- Pendo, Top 10 User Feedback Tools 2026
- Optif, B2B SaaS NRR Benchmarks 939 Companies
- McKinsey, Net Revenue Retention Advantage in B2B Tech
- Averi, 15 Essential SaaS Metrics 2026
- ParallelHQ, What Is Pendo Guide 2026
- Accoil, Pendo Alternatives Worth Trying
- Directive, 2026 Blueprint for Scalable B2B SaaS Marketing
- Pendo, Pricing
- Mixpanel, Pricing
- Amplitude, Pricing
- Userpilot, Pricing
- Appcues, Pricing
- WalkMe, Digital Adoption Platform
- Lenny's Newsletter, Ultimate Guide to Product Launches
- Reforge, Feature Adoption Loops
- Userpilot, Feature Adoption Rate
- Heap, What Is Feature Adoption