

The difference between a funded Series C and a rejected one rarely comes down to market opportunity. It comes down to financial model credibility. In 2026, investors interrogate three dimensions of every SaaS financial model before the cheque clears: driver-based architecture (operational inputs, not top-down guesses), three-statement linkage (P&L, balance sheet, and cash flow interconnected with no orphan numbers), and cohort-based revenue logic (monthly customer cohorts tracked independently). A founder spreadsheet that hides assumptions in a top-down growth rate triggers more diligence questions in two hours than a board-grade model resolves in two months.
This article installs the architecture: what investors expect in 2026, the four-layer model structure, the fourteen canonical metrics every model must compute, the five mistakes that kill fundraising rounds, and how agentic AI is rewriting FP&A for $10M–$40M ARR mid-market SaaS. Built for CEOs who refuse to walk into a board meeting with a number their CFO cannot defend.
What Makes a SaaS Financial Model "Board-Grade"

Every SaaS financial model worth investor attention shares four properties. First, it is driver-based — operational inputs (sales reps, quota attainment, marketing spend, lead-to-MQL rate, MQL-to-SQL rate, win rate, ACV, churn, expansion) build up to revenue rather than top-down growth assumptions. Second, it is cohort-based — monthly customer cohorts retain, expand, and churn independently rather than blending into a single retention curve. Third, the three statements link — P&L revenue ties to deferred revenue on the balance sheet, deferred revenue ties to cash flow from operations, and no number lives in isolation. Fourth, the model produces scenario outputs — base, bull, bear cases that sensitize the assumptions investors care about most.
The 2026 investor bar is firm: a Series B/C/D model must hold ±5% accuracy for the next quarter, ±15% for the next twelve months, and demonstrably link operational reality to financial output. ICONIQ's 2025 State of Software and Benchmarkit's 2025 SaaS Performance Metrics both flag forecast variance as a top-three reason for failed Series C rounds.
The Investor Test
If an investor asks "what happens to your runway if NRR drops 8 points and CAC payback extends 6 months?" — your model should answer in seconds, with three statements re-rolling. If it cannot, you are not yet board-grade.
The Four-Layer Architecture
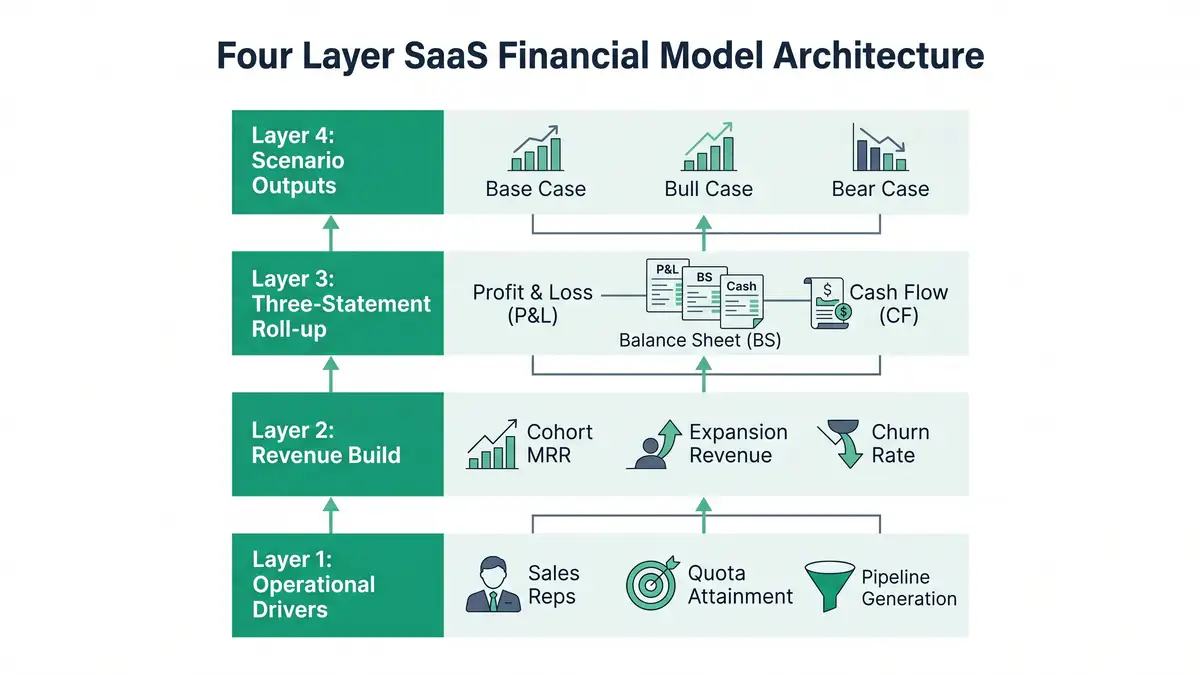
A board-grade SaaS financial model stacks vertically, with each layer feeding the next. Inverting the order — starting from a target ARR and reverse-engineering — is the most common reason mid-market models fail diligence.
Layer 1: Operational Drivers
Sales rep count, ramp time (typically 4–6 months), quota attainment (60–70% mid-market median), pipeline coverage (3–4x), win rate (20–30%), average ACV, sales cycle length. Marketing inputs: paid spend, organic-lead pipeline, MQL-to-SQL conversion. Every revenue dollar in the model traces back to a specific operational input. Breaking Into Wall Street's SaaS metrics tutorial documents the canonical driver build.
Layer 2: Cohort Revenue Build
Each monthly customer cohort tracked independently across its lifetime — initial ACV, expansion ARR, contraction, churn. Blended retention rates hide cohort variance and produce systematically wrong forecasts. Cohort logic is non-negotiable above $10M ARR. See Cube's GRR vs NRR methodology and your Net Dollar Retention playbook for the cohort math investors trust.
Layer 3: Three-Statement Roll-Up
P&L (revenue, COGS, S&M, R&D, G&A, EBITDA), balance sheet (deferred revenue, AR, accrued expenses, working capital), cash flow (operating, investing, financing). Linkages must be explicit: deferred revenue moves with billings, not just revenue; AR ties to invoice timing; CFO ties to net income via working-capital changes. Vena's three-statement model guide documents the linkages that investors verify line by line.
Layer 4: Scenario Outputs
Base / bull / bear cases that flex the assumptions investors most question — NRR, CAC payback, win rate, churn, ACV. Each scenario re-rolls all three statements and surfaces the runway, EBITDA, and Rule of 40 implications. F. Institute's board-deck template shows the scenario presentation investors expect.
Want to see your own CAC against peer benchmarks? Run the CAC Diagnostic for your true CAC, the 30 to 50% reduction agentic deployment delivers, and a board-ready PDF in 60 seconds.
Run the CAC DiagnosticThe 14 Canonical SaaS Metrics Every Model Must Compute
A board-grade model does not present metrics in isolation. It computes them from the same operational drivers, links them across the three statements, and benchmarks them against 2026 mid-market reality.
| Metric | 2026 Mid-Market Benchmark | Why Investors Care |
| ARR Growth Rate | 26% median; 45-60% top quartile | Primary growth signal |
| Net Dollar Retention (NDR) | 108% median; 120%+ top quartile | Expansion architecture proof |
| Gross Dollar Retention (GDR) | 85-92% median | Churn floor |
| Customer Acquisition Cost (CAC) | $1,200 blended median | Acquisition efficiency |
| CAC Payback Period | 20 months median; <12 top quartile | Capital efficiency |
| LTV:CAC Ratio | 3:1 floor; 4:1-5:1 healthy | Unit economics |
| Magic Number | 0.7-1.0 healthy; 1.5+ exceptional | Sales efficiency |
| Rule of 40 | 40+ healthy; only ~30% public SaaS clear | Growth × profitability balance |
| Gross Margin | 75%+ healthy | Software economics |
| Burn Multiple | <1.0 top quartile; <2.0 healthy | Cash efficiency per ARR added |
| Revenue Per Employee (RPE) | $129K-$283K; AI-native $1M+ | Operational leverage |
| S&M as % Revenue | 35-50% mid-market | Investment intensity |
| R&D as % Revenue | 20-35% mid-market | Innovation capacity |
| RPO (Remaining Performance Obligations) | Multi-year contracts as % ARR | Forecast credibility |
Sources: Benchmarkit 2025, ICONIQ State of Software 2025, SaaSDB Rule of 40 Benchmarks, L40° Burn Multiple Explainer, Lighter Capital S&M Spend Index, SaaS Capital RPE Benchmarks.
Each of these metrics has a deserved standalone treatment. For depth on the most board-watched five, see your SaaS unit economics framework, CAC reduction levers, LTV:CAC ratio guide, Rule of 40 deep-dive, and Revenue Per Employee benchmarks.
Diagnose which of the 14 canonical metrics your model computes — and which it fakes.
Book a Growth Mapping CallCohort Revenue Build: The Investor's Lens

Investors do not trust blended retention. They trust cohort tables. A board-grade model presents each monthly customer cohort as an independent track: starting ARR, monthly retention rate, expansion ARR added, contraction subtracted, ending ARR. The cohort table reveals what blended NRR hides — that a 110% blended NRR may mask a 130% enterprise cohort and a 92% SMB cohort, two utterly different businesses combined into one false comfort number.
Cohort modelling unlocks three investor-grade analyses simultaneously: (1) accurate LTV calculation using gross-margin LTV (ARPA × GM ÷ Gross Monthly Churn) per cohort segment; (2) defensible CAC payback by cohort, exposing whether long-payback cohorts are subsidising short-payback ones; (3) credible scenario stress-testing — what happens to ARR if SMB churn rises 4 points while enterprise NRR holds. Baremetrics' predictive LTV analysis and The SaaS CFO (Ben Murray) — SaaS Financial Model Excel document the cohort-build patterns investors look for.
Scenario Planning: The Three-Case Discipline

Series B+ investors in 2026 expect three scenarios out of every model — base, bull, bear. Each must flex the same eight to ten assumptions and roll forward through all three statements. The base case reflects management's expected trajectory; the bull case sensitizes upside (NRR 8 points higher, CAC payback 6 months shorter); the bear case stress-tests downside (NRR 8 points lower, win rate 5 points lower, gross margin 3 points compressed). The runway, EBITDA, and Rule of 40 implications of each scenario should be visible at a glance.
Scenario discipline matters for two reasons. First, it forces management to think probabilistically — most CEOs have not stress-tested their plan against real downside. Second, it gives investors confidence that management understands the operating envelope. Mosaic's predictive finance research documents the modelling sophistication that distinguishes funded from rejected rounds. The expansion revenue strategy and your NRR architecture are the operational systems that turn the bull-case assumptions into a plan investors believe.
Five Modelling Mistakes That Kill Fundraising Rounds
Mistake 1 — Top-Down Growth Assumptions
Setting "we'll grow 80% next year" without operational backing is the fastest path to investor rejection. Every revenue dollar must build from sales reps × quota × attainment × win rate × ACV. If you cannot trace it back, neither can a serious investor.
Mistake 2 — Blended Retention Curves
A single blended NRR/GDR rate hides cohort variance and produces systematically wrong forecasts. Investors will ask for cohort tables in DD; if your model cannot produce them in seconds, the round stalls.
Mistake 3 — Flat CAC Assumptions
Assuming CAC stays constant as you scale is empirically wrong. CAC inflates as you exhaust efficient channels; the model must reflect channel saturation and segment-specific CAC inflation. CAC build by channel is non-negotiable.
Mistake 4 — Missing Three-Statement Linkage
P&L revenue not tying to deferred revenue, deferred revenue not tying to cash, AR not tying to invoice timing — these orphan numbers are the single fastest diligence kill. Three statements either link explicitly or your model is not credible.
Mistake 5 — No Scenario Cases
One number in a financial model is a hope. Three numbers (base / bull / bear) is a plan. Investors do not expect you to know the future; they expect you to have stress-tested it. PrometAI's mistake taxonomy documents the same five errors across rejected SaaS rounds.
Agentic AI as the Next-Gen FP&A Layer

The 2025–2026 inflection in financial modelling is agentic. AI tools — Mosaic, Pigment AI, Cube, Vena, Pry — are running variance analysis, anomaly detection, automated reforecasting, and natural-language scenario generation that previously required 3–5 FP&A analysts. Runway's analysis of dimensional modelling vs spreadsheet-first planning documents the architectural shift; Mosaic's predictive finance research documents specific 2026 deployments lifting forecast accuracy by 25–40% while compressing reforecast cycles from weeks to hours.
The structural shift is from CFO-as-spreadsheet-assembler to CFO-as-strategist with autonomous agents handling the reconciliation layer. Your agentic workflow orchestration plus CRM automation spine becomes the upstream input — operational data flowing in real time into the model that produces the board deck. Mid-market SaaS that adopts this stack will be running monthly reforecasts in hours rather than weeks by mid-2026.
Bottom Line
A SaaS financial model is not a spreadsheet. It is the single document that translates operational reality into investor conviction — and the architectural decisions you make in the model determine whether your next round closes in eight weeks or stalls in diligence indefinitely. The four-layer build (operational drivers → cohort revenue → three-statement roll-up → scenario outputs) is the standard. The fourteen canonical metrics, computed from the same drivers and benchmarked against 2026 mid-market reality, is the metric set. The five common mistakes (top-down assumptions, blended retention, flat CAC, missing linkage, no scenarios) are what investors flag in the first ten minutes of diligence. The CEO's job is not to delegate the model to the CFO and hope. It is to install the architecture that makes the model defensible from line one. Companies that miss this transition spend twelve months prepping for a round and still get rejected. Companies that complete it close at the multiple their unit economics deserve.
Install the Board-Grade Financial Operating System
peppereffect architects the four-layer SaaS financial model — operational driver build, cohort revenue logic, three-statement linkage, scenario outputs — wired to your CRM, billing system, and product analytics for $10M-$40M ARR mid-market SaaS CEOs preparing for Series B/C/D fundraising or board-grade reporting. Diagnostic call. Architectural blueprint. 90-day deployment.
Book Your Growth Mapping CallSee the Sales Automation Architecture →
Frequently Asked Questions
What is a SaaS financial model?
A SaaS financial model is the spreadsheet (or FP&A platform) that builds revenue from operational drivers (sales reps, quota attainment, MRR cohorts, churn rates), rolls those drivers through three linked financial statements (P&L, balance sheet, cash flow), and produces base / bull / bear scenarios for board reporting and investor diligence. A board-grade model differs from a founder spreadsheet in four ways: driver-based, cohort-based, three-statement linked, scenario-output ready.
What metrics should a SaaS financial model include?
The 14 canonical metrics every board-grade SaaS model must compute: ARR growth rate, NDR, GDR, CAC, CAC payback, LTV, LTV:CAC, Magic Number, Rule of 40, gross margin, burn multiple, revenue per employee, S&M as % revenue, R&D as % revenue. Each computed from the same operational drivers and benchmarked against 2026 mid-market data.
What's the difference between a SaaS financial model and a startup financial model?
A SaaS financial model treats recurring revenue as cohort-based (each monthly customer cohort tracked independently) and tracks subscription-specific metrics (NDR, MRR, ARR, churn, expansion). A general startup model typically uses transactional revenue assumptions and lacks cohort logic. SaaS-specific models are required by all SaaS-focused investors at Series B and beyond.
How long should a SaaS financial model forecast horizon be?
Industry standard is 3–5 years monthly. Year 1 should hit ±5% accuracy quarterly and ±15% annually. Years 2–3 are scenario-driven (base / bull / bear). Years 4–5 are directional. Investors do not expect perfect long-term accuracy; they expect rigorous near-term modelling and credible long-term scenarios.
What's the burn multiple and why does it matter?
Burn multiple = Net Burn ÷ Net New ARR. It measures how much cash you burn to add a dollar of new ARR. Top quartile is <1.0 (more efficient); healthy is <2.0; struggling is >2.0. Coined by David Sacks, it has become the dominant capital-efficiency metric for 2024-2026 SaaS investors and is now required disclosure in most Series B+ board decks.
Should I use Excel or a dedicated FP&A tool for my SaaS financial model?
Below $10M ARR, Excel/Google Sheets with disciplined structure is sufficient. Above $10M ARR, dedicated FP&A tools (Mosaic, Cube, Pigment, Pry, Vena) deliver three structural advantages: live integration with CRM/billing, built-in cohort logic, and automated scenario generation. By Series C, a dedicated tool is effectively required for board-grade reporting cadence.
How much detail should a board-deck financial summary include?
The board-deck financial summary should fit on one slide: ARR (current/forecast), NDR, growth rate, gross margin, CAC payback, burn multiple, runway, Rule of 40 score. The full model lives in an appendix or shared workspace; the slide is the executive summary investors interrogate from. F. Institute, Bessemer, and ICONIQ all publish reference templates aligned to this structure. marketing automation platform comparison bootstrap vs venture funding decision 14-slide board deck framework
Resources
- ICONIQ — State of Software 2025
- Benchmarkit — 2025 SaaS Performance Metrics
- Bessemer Venture Partners — AI Pricing & Monetization Playbook
- Bessemer Venture Partners — State of AI 2025
- SaaS Capital — Revenue Per Employee Benchmarks
- SaaS Capital — AI Assessment Framework
- Vena Solutions — Three-Statement Financial Model Guide
- Cornell Finance — SaaS Financial Modeling for Founders
- Breaking Into Wall Street — SaaS Metrics Tutorial
- The SaaS CFO — SaaS Financial Plan Guide
- Mostly Metrics — Revenue Per Employee, the GOAT of SaaS Metrics
- Mosaic — Predictive Finance: The Next CFO Advantage
- Runway — Dimensional Modeling vs Spreadsheet-First Planning
- L40° — Burn Multiple Explainer
- SaaSDB — Rule of 40 Public SaaS Benchmarks
- Cube — GRR vs NRR Methodology
- Lighter Capital — Public SaaS S&M Spend Index
- F. Institute — Perfect Board Deck Template
- Meritech — Software Pulse
- The VC Corner — SaaS Financial Model Template Reference
- PrometAI — Startup Financial Model Mistakes
- Baremetrics — Predictive Analytics for SaaS LTV


