

What Is the LTV:CAC Ratio?
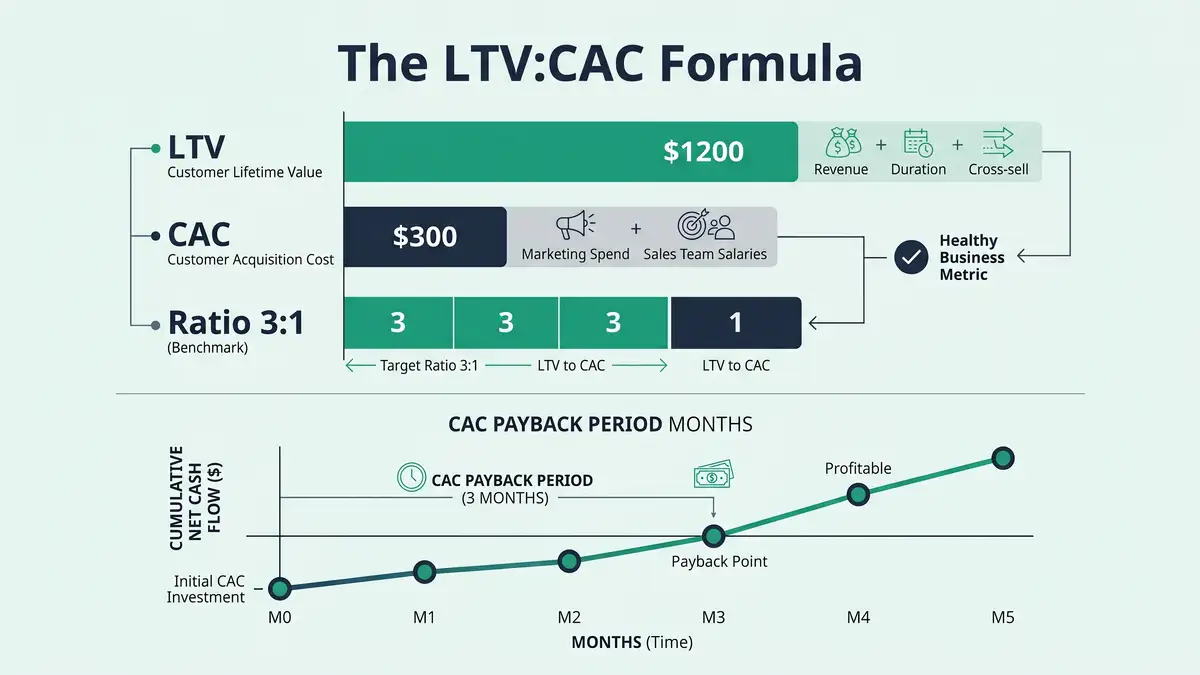
The LTV:CAC ratio compares the gross-margin profit a customer generates over their lifetime (LTV) against the fully loaded cost to acquire them (CAC). It is the single metric that reveals whether a B2B SaaS business is building a Freedom Machine or a hamster wheel dressed up as growth. A ratio below 3:1 means unit economics are broken; a ratio above 5:1 usually signals under-investment in acquisition, not excellence.
In 2026, as boards tighten discipline and capital efficiency overtakes growth-at-all-costs, LTV:CAC has become the primary lens used by SaaS investors to decide whether to fund expansion. The median B2B SaaS company operates between 3:1 and 5:1, with top-quartile operators clearing 7:1 through retention compounding and agentic cost compression. The bottom quartile, running below 2:1, are typically one renewal cycle away from a forced pivot or down round.
What you'll learn in this article:
- The only LTV:CAC formula that survives finance-team scrutiny (and the three common miscalculations that inflate it)
- Benchmarks by ARR stage, ACV tier, and go-to-market motion — so you know whether your 4:1 is strong or soft
- Why CAC payback period often matters more than the ratio itself for cash-constrained scale-ups
- How net revenue retention (NRR) compounds a 3:1 ratio into 8:1 without touching acquisition spend
- The specific agentic AI levers that compress CAC 20-40% across lead generation, qualification, and nurture
Key Takeaway
LTV:CAC is not a marketing metric. It is the single integrated diagnostic for the entire customer lifecycle — acquisition efficiency, activation quality, retention durability, and expansion velocity. If the ratio is broken, at least one pillar of the business system is broken, and no amount of top-of-funnel activity will fix it.
How Do You Calculate LTV:CAC Correctly?
The canonical formula, refined by David Skok across decades of SaaS investing, is LTV = (ARPA × Gross Margin) / Churn Rate, divided by CAC = (Sales + Marketing Spend) / New Customers Acquired. The math looks simple. Most founders get it wrong in three specific ways that systematically inflate the ratio and delay the moment of reckoning.
The first error is using revenue LTV instead of gross-margin LTV. A $100k ACV customer with 70% gross margin contributes $70k of lifetime value, not $100k. The second is ignoring fully loaded CAC — excluding sales development, RevOps tooling, and allocated engineering time for onboarding. The third, and most dangerous, is using blended CAC across paid, organic, and referral channels, which hides the fact that one channel is unprofitable and being subsidised by the others. As David Skok's SaaS Metrics 2.0 framework makes clear, segmented CAC by channel and cohort is the only version finance teams should trust.
| Input | Correct Source | Common Miscalculation |
| ARPA | Annualised, segmented by cohort | Blended across plans, including discounts |
| Gross Margin | Actual, post-hosting, support, COGS | Revenue-only (inflates LTV 20-40%) |
| Churn Rate | Gross revenue churn, monthly cohort | Net churn (masks real leakage) |
| CAC | Fully loaded S&M + RevOps + Onboarding | Paid ad spend only |
Sources: David Skok — SaaS Metrics 2.0, Stripe — CAC in SaaS

The 4 Pillars Playbook breaks down the entire framework with deployment maps, KPIs, and real case studies across SaaS, recruiting, and coaching.
Open the Interactive PlaybookWhat Is a Good LTV:CAC Ratio for SaaS?
3:1 is the survival floor. 5:1 is the operational target. 7:1+ is where category leaders live. But those numbers shift dramatically by ARR stage, contract value, and go-to-market motion. A $50M ARR enterprise business with a 6-week sales cycle should operate at a different ratio than a $5M ARR product-led SMB company with a 3-day trial-to-paid journey.
According to First Page Sage's 2025 benchmark analysis, the median LTV:CAC across 300+ B2B SaaS companies is 4.0:1, but dispersion is wide: product-led companies cluster around 4.5:1, sales-led enterprise companies around 3.2:1, and hybrid motions (where agentic workflows compress qualification cost) increasingly post 5:1+. Crucially, Bessemer's State of the Cloud AI report notes that best-in-class operators now post 6:1 through a combination of retention engineering and AI-driven CAC reduction.
| Stage | ACV Range | Healthy LTV:CAC | CAC Payback Target |
| Early-stage ($1M-$10M ARR) | $5k-$25k | 3.0:1 – 4.0:1 | 12-18 months |
| Growth ($10M-$50M ARR) | $25k-$100k | 4.0:1 – 5.5:1 | 9-15 months |
| Scale ($50M+ ARR) | $100k+ | 5.0:1 – 7.0:1+ | 6-12 months |
Sources: First Page Sage 2025 SaaS LTV:CAC, Bessemer State of the Cloud AI, Benchmarkit 2025 SaaS Performance Metrics
Key Takeaway
Compare your LTV:CAC to your stage and motion peer group, not the industry average. A 3.8:1 ratio is excellent at Series A and mediocre at Series C — the bar rises as customer concentration falls and acquisition channels compound.
Want to see your own CAC against peer benchmarks? Run the CAC Diagnostic for your true CAC, the 30 to 50% reduction agentic deployment delivers, and a board-ready PDF in 60 seconds.
Run the CAC DiagnosticWhy CAC Payback Period Matters More Than the Ratio Itself

LTV:CAC tells you whether a customer is eventually profitable. CAC payback tells you when. For a cash-constrained scale-up, an 8:1 ratio with a 30-month payback period is materially worse than a 4:1 ratio with a 9-month payback — because the second business is self-funding its next cohort while the first is burning runway waiting for LTV to materialise.
Bessemer's cloud investors now treat CAC payback as the leading capital-efficiency indicator, flagging anything beyond 18 months as a serious working-capital risk. The reason is structural: payback horizon compounds against every subsequent cohort, so a long payback period effectively caps growth velocity regardless of how attractive the end-state LTV looks. This is why the best-run SaaS companies engineer their onboarding sequence to hit first value in under 14 days — compressing activation shortens payback mechanically.
How Does NRR Turn a 3:1 Ratio Into 8:1?
Net revenue retention is the single biggest lever in the LTV equation, and it is mathematically non-linear. A company with 120% NRR grows its existing customer base by 20% per year without acquiring a single new logo — which means the denominator in LTV (churn) is effectively negative for the retained cohort, and contract values expand through upsell and seat growth.
Consider the math: a customer with $50k ARPA, 70% gross margin, and 5% gross churn produces $700k in LTV. Shift that customer into a 125% NRR cohort — the same gross churn, plus 30% expansion — and LTV compounds to roughly $1.6M against the same acquisition cost. The ratio doesn't double. It triples. This is why ChartMogul's SaaS Go-to-Market Report identifies NRR as the single strongest predictor of enterprise value multiple at IPO.

According to SaaS Capital's 2025 retention study, median gross retention for private B2B SaaS sits at 91%, while median NRR sits at 110%. Top-quartile operators post 130%+ NRR — and their LTV:CAC ratios do not cluster around the median 4:1, they cluster around 7:1-9:1. The expansion mechanism matters more than the acquisition mechanism once a company crosses $10M ARR.
Avoid This Mistake
Do not report NRR without disclosing the denominator. "125% NRR" applied only to your top 20 customers is not a business-wide health metric — it is a sampling artifact. Boards and sophisticated investors now ask for logo-cohort NRR segmented by ACV band. If your expansion is concentrated in three whale accounts, your ratio is fragile, not strong.
Where Can Agentic AI Compress CAC Without Hurting Pipeline Quality?
CAC compression used to be a trade-off: cut spend and accept slower pipeline. Agentic AI breaks that trade-off. By deploying autonomous systems across lead generation, qualification, enrichment, and nurture, best-in-class operators are cutting 20-40% of CAC while holding or improving pipeline velocity. McKinsey's research on gen AI in B2B sales quantifies the lift at 10-20% in productivity for revenue functions that deploy agents in their core workflows.
Gartner predicts that by 2028, AI agents will outnumber human sellers by 10x. That is not a productivity story — it is a cost-structure story. The LTV:CAC ratios of companies that deploy agentic infrastructure early will structurally diverge from those that don't. The four levers below are where the compression actually happens.
Autonomous Lead Enrichment
Deploy agents that enrich every inbound lead against 40+ data sources before a human touches the record. Cuts SDR research time 60-80% and eliminates unqualified calls entirely. Measurable impact: CAC reduction of 15-25%.
Agentic Qualification & Routing
Install qualification agents that score, route, and schedule meetings based on ICP-fit logic instead of first-touch heuristics. The best operators now book meetings in under 90 seconds from inbound. Cycle compression alone reduces blended CAC 10-15%.
Autonomous Nurture Sequences
Replace drip campaigns with context-aware agents that personalise sequences based on behavioural signals, account triggers, and content engagement. Agentic nurture typically lifts MQL-to-SQL conversion 30-50% with zero additional headcount.
CRM Automation for Deal Hygiene
Deploy CRM automation agents that maintain deal stage integrity, flag pipeline risk, and generate follow-up cadences autonomously. Eliminates 8-12 hours per week of admin per rep, converting the saved capacity into pipeline-building activity.
Want to model the CAC impact of deploying agentic workflows across your revenue engine?
Diagnose Your CAC Structure
Which Levers Move LTV:CAC Fastest?
Most founders try to improve LTV:CAC by chasing acquisition channels. That's the slow lever. The fast levers — gross margin, churn compression, onboarding velocity, and expansion motion — typically move the ratio 2-3x faster than top-of-funnel optimisation, because they compound against the existing customer base rather than requiring fresh pipeline.
Here is the order of operations that produces the highest ratio lift per hour of executive attention, drawn from SaaS Capital's 2025 growth benchmarks and the compression patterns we see across our own installed base.
| Lever | Typical Ratio Impact | Time to Impact |
| Compress time-to-value in onboarding | +0.5 to +1.2x | 30-60 days |
| Install agentic qualification + enrichment | +0.8 to +1.5x | 45-90 days |
| Rebuild expansion motion (NRR lift) | +1.5 to +3.0x | 90-180 days |
| Repricing to reflect value delivered | +0.4 to +1.0x | 60-120 days |
| Kill unprofitable acquisition channels | +0.3 to +0.7x | Immediate |
Sources: SaaS Capital 2025 Growth Benchmarks, Appcues — Onboarding Retention Curves
Notice that the largest single lever is expansion motion — the compound effect of NRR on LTV is where the best operators produce 2-3x improvements in 6 months. This is exactly why decoupling revenue from headcount via autonomous fulfillment and expansion infrastructure is the defining operational move of the agentic era.
Frequently Asked Questions
How do you calculate LTV:CAC ratio for SaaS correctly?
Use gross-margin LTV, not revenue LTV. The formula is LTV = (ARPA × Gross Margin) / Gross Monthly Churn, divided by fully loaded CAC (all sales, marketing, RevOps, and onboarding costs divided by new customers acquired in the period). Segment by cohort and channel — a blended calculation hides which acquisition sources are unprofitable. Most finance teams now require cohort-level LTV:CAC reporting because company-wide averages mask dangerous dispersion. For a deeper walkthrough of the full SaaS metric stack, see our SaaS CAC deep-dive.
What is a good LTV:CAC ratio for B2B SaaS?
3:1 is the survival floor. 4:1-5:1 is the operating target for growth-stage SaaS. 6:1+ is where category leaders operate, usually via a combination of 125%+ NRR and agentic CAC compression. A ratio above 7:1 often signals under-investment in growth — healthy businesses reinvest excess efficiency into acquisition until the ratio normalises. Benchmarks shift by stage: early-stage ($1M-$10M ARR) typically runs 3.0:1-4.0:1, scale-stage ($50M+ ARR) typically runs 5.0:1-7.0:1.
Why is CAC payback period as important as LTV:CAC ratio?
LTV:CAC tells you whether a customer is eventually profitable; CAC payback tells you how long cash is tied up before the business can self-fund the next cohort. For cash-constrained scale-ups, a 4:1 ratio with 9-month payback is often stronger than an 8:1 ratio with 30-month payback because the first business is funding its own growth velocity. Bessemer treats any payback beyond 18 months as a working-capital risk. The fastest way to compress payback is to shorten time-to-value in onboarding — activation speed is the mechanical driver.
How does NRR affect LTV:CAC ratio?
Net revenue retention is the single strongest lever in the LTV equation because its effect is non-linear. A customer cohort at 125% NRR triples LTV compared to a 100% NRR cohort against identical CAC — the ratio does not just double, it compounds. Median private SaaS NRR sits at 110%; top-quartile operators post 130%+ and their LTV:CAC ratios cluster around 7:1-9:1. This is why expansion motion investment typically outperforms acquisition channel optimisation by 2-3x in ratio impact.
How can AI reduce CAC for SaaS companies?
Agentic AI compresses CAC 20-40% across four specific levers: autonomous lead enrichment (cuts SDR research time 60-80%), agentic qualification and routing (compresses meeting-booking time to under 90 seconds), autonomous nurture sequences (lifts MQL-to-SQL conversion 30-50%), and CRM automation for deal hygiene (eliminates 8-12 hours/week of admin per rep). Gartner predicts that by 2028 AI agents will outnumber human sellers by 10x — the cost-structure divergence between early and late adopters will be the defining competitive gap of the next five years.
Install the Systems That Push LTV:CAC Past 5:1
peppereffect architects the agentic lead generation, qualification, nurture, and CRM automation infrastructure that compresses CAC 20-40% and expands LTV through durable retention engineering. Diagnose your unit economics with a Growth Mapping Call and get a specific roadmap for your ratio.
Book a Growth Mapping CallResources
- First Page Sage — SaaS LTV:CAC Ratio Benchmarks 2025
- David Skok — SaaS Metrics 2.0 (foundational LTV/CAC framework)
- Bessemer Venture Partners — State of the Cloud AI 2025
- Stripe — Customer Acquisition Cost in SaaS
- ChartMogul — SaaS Go-to-Market Report (NRR analysis)
- SaaS Capital — Private SaaS Retention Benchmarks 2025
- McKinsey — Unlocking Profitable B2B Growth Through Gen AI
- Gartner — AI Agents to Outnumber Sellers 10x by 2028


