Most B2B SaaS founders treat annual contract value as a passive output of whatever deals close that quarter. The discount-driven SDR negotiates 22% off list to win the logo, the AE bundles two free seats to clear the procurement gate, the CRO approves a 15% multi-year discount under pipeline pressure, and the average ACV drifts down quarter over quarter. Twelve months later the board asks why CAC payback is 28 months and why the move upmarket stalled at $35K average ACV instead of $80K. The answer is that ACV is not an output, it is an engineered input. This guide installs the four-lever framework that lifts average ACV without losing velocity, the one move that compresses CAC payback below 18 months and unlocks the move upmarket.
Built for $10M to $40M ARR B2B SaaS (Sarah Chen). Operations/Management pillar. The discipline is the same one that compounds across the rest of the operations stack: engineered systems, not heroics.
The economics of disciplined ACV
Before the framework, the case for the framework. The Founders Corner's analysis of Bessemer benchmarks documents the structural pattern: CAC payback drops from 24 to 30 months at SMB ACV ($1K-$15K) to 12 to 18 months at Enterprise ACV ($100K+). The same dollars of CAC produce dramatically faster payback at higher contract values, with lower churn and higher expansion compounding the effect.
100Founders' analysis of OpenView's 2025 SaaS Benchmarks reinforces the point: companies prioritizing value-based pricing over cost-plus models see a 25% higher expansion rate, which compounds with ACV optimization to drive multi-million-dollar NRR uplift on the same customer base. Paddle's 2026 SaaS pricing analysis documents the multi-year economic structure: 3 to 5% annual price uplifts, locked into Year 2 and Year 3, protect ACV from competitive erosion while delivering predictable cash flow.
The ACV Optimization Test
For a $20M ARR SaaS at $25K average ACV, lifting average ACV to $50K via the four-lever framework drives roughly the same dollar volume from half as many customers, with CAC payback compressing from 24 months to 14 months. That is $4M to $6M in CAC redeployment freedom annually, plus 8 to 15 percentage points of NRR uplift through expansion compounding. At a 5x revenue multiple, the structural enterprise-value gain is $40M+ on the same customer book.
The four levers of ACV optimization
Average ACV moves through four engineered levers, each with its own owner, metric, and intervention playbook. Skip a lever and the others compound less.
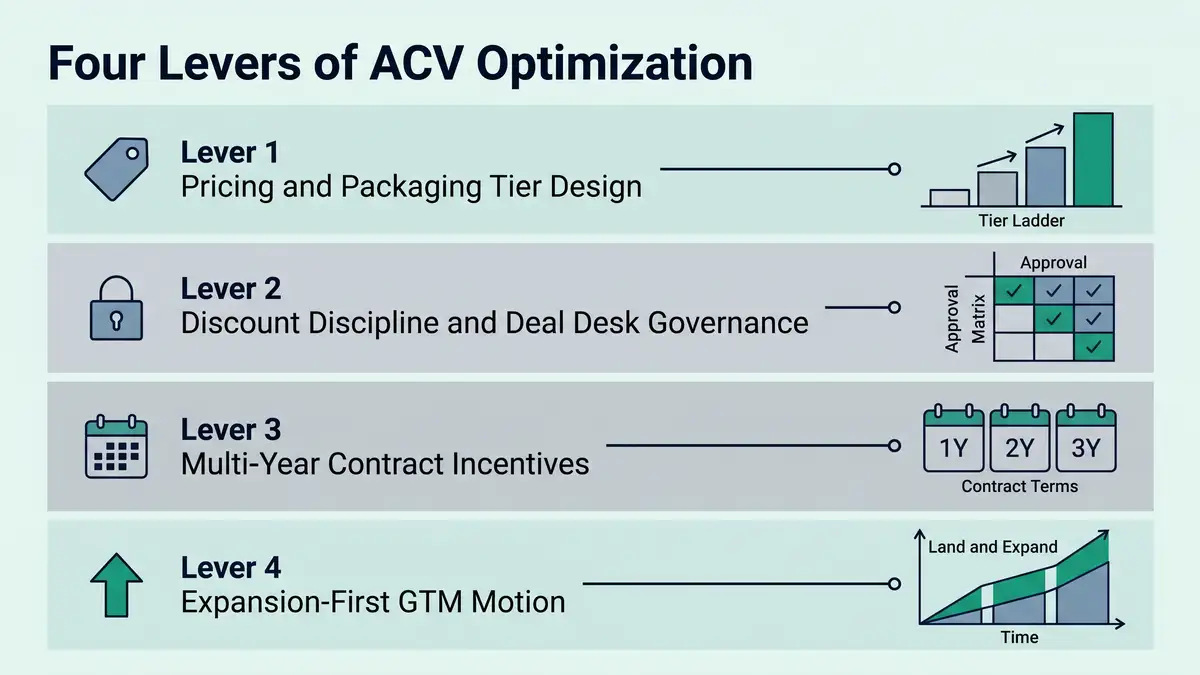
Lever 1: Pricing & packaging tier design
The structural foundation. The pricing page determines the upper bound of average ACV. SaaS without an explicit Enterprise tier ($100K+) cannot meaningfully grow ACV regardless of sales effort. Pipelineroad's 2026 B2B SaaS pricing guide documents the four-tier canonical structure (Free/Starter, Growth, Business, Enterprise) with explicit usage caps that force account-size segmentation. Failure mode: one-pricing-fits-all flat per-seat pricing that caps ACV at $20-30K regardless of customer size.
Lever 2: Discount discipline & deal desk governance
The defensive layer. Ad-hoc AE-led discounting erodes 8 to 15 points of margin and trains customers to expect Year-2 discounts. DealHub's 2026 deal desk best practices documents the governance structure: tiered approval matrix (under 10% AE-approved, 10-20% Director, 20-30% VP, over 30% CRO/CFO), sunset auto-discounts in Year 2, mandatory deal desk review at over 15% discount or over $250K TCV. Top-quartile programmes hold blended discount under 12% on Enterprise; median sits at 22 to 28%.
Lever 3: Multi-year contract incentives
The cash-flow and retention layer. Subskribe's multi-year contract analysis documents the canonical structure: Year 1 list, Year 2 +8-12% uplift, Year 3 +6-10% uplift, with prepay or quarterly billing options. ICONIQ's 2026 Topline Growth and Efficiency research documents that top-quartile B2B SaaS hits 35 to 50% multi-year contract penetration in the Enterprise segment. The customer benefit: locked-in pricing, simpler procurement renewal. The vendor benefit: cash flow, reduced churn risk, larger TCV per acquired logo.
Lever 4: Expansion-first GTM motion
The compounding layer. Land at a strategic-account smaller ACV ($30-60K), expand through QBRs, feature adoption, and seat expansion to $150-300K within 24 months. McKinsey's NRR Advantage research shows top-quartile B2B SaaS pulls 30 to 60% Year 2-3 expansion on the original ACV. The expansion path is structurally higher-margin than new-logo acquisition because CAC was already paid in Year 1. Expansion revenue strategy is the load-bearing input here.

ACV vs ARR vs TCV: the definitions that matter
Half the ACV reporting fights inside RevOps come from terminology drift. Maxio's ACV vs ARR analysis documents the precise definitions:
| Metric | Definition | Calculation | Use case |
| ACV (Annual Contract Value) | Average annual revenue per contract | Total Contract Value / contract years | Deal sizing, sales segmentation |
| TCV (Total Contract Value) | Total revenue across full contract term | ACV x years + one-time fees | Multi-year deal valuation |
| ARR (Annual Recurring Revenue) | Run-rate annual recurring revenue | MRR x 12 (recurring only) | Company growth metric |
| CARR (Contracted ARR) | ARR including signed but not yet started | ARR + future-dated bookings | Forward-looking pipeline signal |
Sources: Maxio ACV vs ARR, ChartMogul SaaS Benchmarks 2026, Paddle Pricing 2026.
The traps to avoid: confusing one-year contracts with multi-year (always divide TCV by years for ACV), double-counting one-time implementation fees in ACV, and treating CARR as ARR before contracts go live. Customer success metrics rely on these distinctions being clean.
The 2026 ACV benchmark table
| Segment | ACV range | Sales cycle | CAC payback | Multi-year penetration |
| SMB ($1K-$15K ACV) | $3K-$12K median | 14-30 days | 18-30 months | 5-15% |
| Mid-Market ($15K-$100K ACV) | $25K-$60K median | 30-90 days | 14-22 months | 15-30% |
| Enterprise ($100K-$250K ACV) | $120K-$200K median | 90-180 days | 12-18 months | 30-45% |
| Strategic Enterprise ($250K+ ACV) | $300K-$1M+ median | 180-365 days | 10-15 months | 40-55% |
Sources: OpenView 2025 SaaS Benchmarks, ICONIQ 2026, Bessemer Atlas 2026, ChartMogul 2026.
The structural insight: longer sales cycles at higher ACV are MORE than offset by faster CAC payback. The trap most SMB-native SaaS founders fall into is fearing the longer cycle and missing the structurally better unit economics. The move upmarket is the highest-leverage capital-efficiency play available to $10M to $40M ARR B2B SaaS in 2026.

The seven-step ACV optimization install
Audit the current ACV cohort distribution
Pull 24 months of closed-won deals. Calculate average ACV by quarter, by segment, by AE, by lead source. Identify the 80/20: the deal characteristics that produce above-median ACV. Most teams discover that 30% of deals deliver 70% of revenue, with clear pattern signals (vertical, persona, deal source, geo). The audit is the foundation. You cannot optimize what you have not measured.
Refine the ICP and persona for upmarket
Lift ACV by lifting ICP fit, not by squeezing existing accounts. Move the persona from Manager to Director to VP to C-level as average company size targets shift from 50 to 200 to 500 to 2,000+ employees. Use case shifts from single-team to multi-team to enterprise-wide. B2B buyer journey mapping is the framework here.
Add or rebuild the Enterprise pricing tier
If the pricing page tops out at "Pro $499/seat", there is no upmarket runway. Add an Enterprise tier with explicit features (SSO, audit logs, dedicated support, SLAs, custom contracts), priced at 2 to 4x the next tier with usage caps that force segmentation. CRV's B2B pricing framework documents the canonical Enterprise tier specification.
Stand up the deal desk with approval matrix
Tiered approval (under 10% AE, 10-20% Director, 20-30% VP, over 30% CRO/CFO). Mandatory deal desk review at over 15% discount or over $250K TCV. Sunset auto-discounts after 12 months. Train AEs on value selling, not discount selling. DealHub's 2026 deal desk best practices documents the playbook. Top-quartile programmes drop blended discount from 22-28% to under 12% within 90 days of deal-desk standup.
Engineer multi-year contract incentives
Default contract template: 3-year with Year 2 +8-12%, Year 3 +6-10%, prepay-eligible quarterly. Multi-year discount versus annual: 8 to 12% at signature, recovered through Year 2-3 uplifts. AE compensation weighted toward multi-year (full quota credit on Year 1 of multi-year, partial credit on extension years). Top-quartile programmes hit 35 to 50% multi-year penetration on Enterprise within 12 months.
Wire the expansion-first GTM motion
Land smaller ACV at strategic accounts, expand through quarterly business reviews, feature adoption depth, and seat expansion to 2-3x ACV by Year 2. SaaS Revenue Flow's five-lever revenue analysis documents the structural advantage: expansion-first programmes hit 30 to 60% Year-2 ACV growth on retained accounts.
Recalibrate quarterly
Customer behaviour drifts, competitive pressure shifts, and pricing tiers age. Top-decile programmes review average ACV by cohort every 90 days, retire stale tiers, refresh the Enterprise pricing list, and update the deal desk approval matrix. Programmes that ship a pricing page and never revisit it lose 8 to 12 percentage points of effective ACV annually.

Six failure patterns that destroy ACV optimization
Failure 1: One-pricing-fits-all without an Enterprise tier
Pricing pages that top out at "Pro $499/seat" cap average ACV at $20-30K regardless of sales effort. The Enterprise tier is the structural prerequisite, not the consequence, of the move upmarket.
Failure 2: AE-led ad-hoc discounting
Without a deal desk, AEs trade margin for velocity. The result is 22-28% blended discount, a trained customer base that expects Year 2 discounts, and ACV erosion that compounds quarterly. Deal desk discipline is non-negotiable above $50K ACV.
Failure 3: Single-year contracts as default
One-year contracts max out TCV per acquired logo at 1x ACV. Multi-year contracts as the default, with single-year as the exception, lift TCV 2.5 to 3x per logo while improving cash flow and reducing churn risk.
Failure 4: Confusing ACV with ARR in board reporting
The board sees "$3M ACV closed last quarter" and assumes $3M ARR. If the deals were 3-year contracts, only $1M is ARR. The discipline of separating ACV, TCV, and ARR in reporting is foundational. Without it, every forecast is wrong.
Failure 5: Treating expansion as accidental
Programmes without a documented expansion playbook leave 30 to 50% of available expansion ARR on the table. Top-decile programmes engineer the Year 2-3 expansion path through QBRs, feature adoption depth, and seat-expansion mechanics, not through hope.
Failure 6: Optimizing for win rate instead of ACV
Sales orgs that optimize for win rate accept smaller deals to clear the funnel. Sales orgs that optimize for ACV walk away from poor-fit logos and double down on Enterprise opportunities. The metric you optimize is the metric you get. Top-decile programmes track ACV/AE/quarter as the leading sales metric, not deals closed.
The 90-day ACV optimization install
Days 1-30: Audit and design
Audit current ACV cohort distribution. Refine ICP for upmarket. Design the Enterprise pricing tier with feature/usage cap differentiation. Define deal desk approval matrix. Output: ACV baseline by segment, Enterprise tier specified, deal desk policy documented.
Days 31-60: Stand up the systems
Publish Enterprise pricing tier. Stand up deal desk. Train AEs on multi-year incentive structure. Default contract template to 3-year with Year 2-3 uplifts. Output: Enterprise tier live, deal desk operational, multi-year template default.
Days 61-90: Instrument and recalibrate
Stand up ACV-by-cohort dashboards. Track blended discount, multi-year penetration, ACV/AE/quarter. Run first quarterly recalibration based on data. Output: full ACV operating system live, recalibration cadence in place.
What "good" looks like at 12 months
- Average ACV up 2 to 3x (e.g., $25K to $60-80K).
- Blended discount under 12% (vs 22-28% baseline).
- Multi-year contract penetration: 35 to 50% on Enterprise.
- CAC payback compressed from 24+ months to 14-18 months.
- Year 2-3 expansion: 30 to 60% on retained accounts.
- Sales cycle stable or slightly extended (90-180 days vs 60-90 days), more than offset by ACV gains.
- NRR uplift: 8 to 15 percentage points.
- Win rate stable or up: walking away from poor-fit logos lifts AE focus on high-ACV opportunities.
Those deltas are the natural compounding of installing the four-lever framework and recalibrating quarterly. The discipline reinforces the broader operations architecture: B2B customer retention strategy compounds when ACV economics are right, SaaS unit economics calculate cleanly when ACV is engineered, and scaling revenue without headcount is unlocked when each acquired logo carries higher TCV. The same discipline that anchors a SaaS support automation programme anchors ACV optimization: engineered systems, not heroics.
Want a diagnostic on whether your ACV trajectory is engineered or drifting?
FAQ
What is annual contract value (ACV)?
Annual contract value (ACV) is the average annual revenue per customer contract, calculated as Total Contract Value divided by contract years (excluding one-time implementation fees). For a $300K 3-year contract, ACV is $100K. ACV is the standard SaaS metric for sales segmentation, deal sizing, and capital efficiency analysis. Best-in-class B2B SaaS uses ACV cohort tracking to engineer the move upmarket from SMB ($1K-$15K) to Mid-Market ($15K-$100K) to Enterprise ($100K+) without losing velocity.
How do you calculate annual contract value?
ACV = (Total Contract Value − one-time fees) / contract term in years. For a 3-year SaaS deal at $300K total + $50K implementation: ACV = ($300K − $50K) / 3 = $83.3K. For a 1-year contract: ACV equals the recurring portion of TCV. Always strip one-time fees, always divide by contract years for multi-year deals, always segment by ACV tier (SMB / Mid-Market / Enterprise / Strategic Enterprise) for board reporting.
What is the difference between ACV and ARR?
ACV measures the annual revenue per individual contract. ARR measures the run-rate annual recurring revenue across the entire customer base. For a SaaS with 100 customers each at $50K ACV, ARR is roughly $5M (assuming all are active subscriptions, not future-dated). The trap: signing $5M of new ACV in a quarter does not equal $5M of new ARR if those deals are multi-year (only Year 1 hits ARR). CARR (contracted ARR) bridges the gap by including signed-but-not-started contracts.
What is a good annual contract value for B2B SaaS?
For 2026 B2B SaaS, healthy ACV depends on segment: SMB $3K-$12K median, Mid-Market $25K-$60K, Enterprise $120K-$200K, Strategic Enterprise $300K-$1M+. The structural insight: top-quartile programmes lift average ACV 2-3x within 12 months by adding Enterprise pricing tiers, deal desk discipline, and multi-year contract incentives. CAC payback compresses from 24+ months at SMB ACV to 12-18 months at Enterprise ACV, making ACV optimization the highest-leverage capital-efficiency lever available.
How do you increase ACV?
Install the four-lever framework: (1) Pricing & packaging tier design (add an Enterprise tier with usage caps); (2) Discount discipline (deal desk with tiered approval matrix); (3) Multi-year contract incentives (3-year default with Year 2-3 uplifts); (4) Expansion-first GTM motion (land smaller, expand through QBRs and feature adoption to 2-3x by Year 2). Top-decile programmes lift average ACV 2-3x within 12 months and compress CAC payback by 8-10 months in the same window.
What is the difference between ACV and TCV?
TCV (Total Contract Value) is the total revenue across the full contract term, including one-time fees. ACV (Annual Contract Value) is TCV divided by contract years (excluding one-time fees). For a 3-year $300K contract with $50K implementation: TCV = $350K, ACV = $83.3K. TCV is used for deal-level commission calculation and procurement valuation. ACV is used for sales segmentation, capital efficiency analysis, and board reporting.
Should B2B SaaS prioritize ACV or volume?
For $10M to $40M ARR B2B SaaS targeting capital efficiency, ACV optimization beats volume. The same dollar of CAC produces 50-70% faster payback at Enterprise ACV vs SMB ACV. Top-decile programmes walk away from poor-fit small deals to redeploy AE capacity to Enterprise opportunities. The trade-off: longer sales cycles (90-180 days at Enterprise vs 30-90 at Mid-Market), MORE than offset by faster CAC payback, lower churn, and 30-60% expansion in Year 2-3.
How do multi-year contracts affect ACV?
Multi-year contracts protect Year 1 ACV from competitive erosion while delivering predictable Year 2-3 cash flow at higher rates (typical structure: Year 1 list, Year 2 +8-12%, Year 3 +6-10%). Top-quartile B2B SaaS hits 35-50% multi-year penetration in Enterprise. The customer benefit is locked-in pricing and simpler procurement; the vendor benefit is 2.5-3x TCV per acquired logo, reduced churn risk, and improved cash flow that compounds capital efficiency.
Architect ACV optimization that compounds capital efficiency, not one that drifts down with discount-driven deals.
peppereffect installs end-to-end ACV operating systems for $10M to $40M ARR B2B SaaS: the four-lever framework, the Enterprise tier design, the deal desk governance, the multi-year contract structure, the expansion-first GTM motion. Logic-gated execution, not retainer hours.
Resources
- Paddle, SaaS Pricing Models & Strategies 2026
- Pipelineroad, B2B SaaS Pricing Models Guide 2026
- The Founders Corner, CAC Payback Benchmarks by ARR
- 100Founders, Early Stage Startup Pricing Strategy
- T2D3, Great Recalibration B2B SaaS 2026
- Oliver Munro, 60+ SaaS Marketing Statistics 2026
- SaaS Revenue Flow, Revenue Precision Five Levers
- Churnbuster, B2B SaaS Churn Rate Management 2026
- Preston Zeller, SaaS Churn Calculator Benchmarks
- Averi, 2026 B2B SaaS Marketing Playbook
- CRV, B2B Pricing Models for Founders
- OpenView, 2025 SaaS Benchmarks Report
- Bessemer, State of the Cloud 2026
- ICONIQ, Topline Growth and Efficiency 2026
- ChartMogul, SaaS Benchmarks 2026
- McKinsey, NRR Advantage in B2B Tech
- Subskribe, Multi-Year SaaS Contracts
- Maxio, ACV vs ARR vs MRR
- DealHub, Deal Desk Best Practices 2026
- Lenny's Newsletter, Ultimate Guide to Pricing