Most enterprise quarterly business reviews are 90-minute slide recitals where the CSM walks through usage charts the customer's team already saw, the customer politely thanks the team, and nothing changes. That is the QBR theatre pattern, and it is the single most common reason high-ARR enterprise accounts churn or stagnate at flat NRR. A real QBR is something else. It is a five-section commitment-driven business review, the same systemic discipline that anchors a SaaS support automation programme that ends with documented expansion commitments, validated business outcomes, and red-flag escalations resolved in 24 hours. This is the framework that turns enterprise retention from luck into engineered net revenue retention.
This guide installs the QBR framework for $10M to $40M ARR B2B SaaS (Sarah Chen). Operations/Delivery pillar. The objective is to convert every enterprise QBR from a status meeting into a measurable expansion event. Because the customer success motion compounds when QBRs do, and stalls when they don't.
The economics of disciplined QBR motion
Before the framework, the case for the framework. Bain's customer retention economics research shows that a 5pp lift in retention drives 25 to 95% profit improvement. Optif's NRR benchmarks across 939 B2B SaaS companies document median Enterprise NRR at 118%, with top quartile clearing 130%. McKinsey's NRR Advantage research identifies QBR-driven account planning as a top-3 NRR driver for B2B tech, alongside customer health scoring and proactive expansion motion.
The QBR-to-NRR connection is structural. Accounts receiving structured quarterly QBRs retain at 92 to 96%; accounts running on ad-hoc check-ins retain at 70 to 80%. Gainsight's 2026 Essential Guide to Customer Success documents the broader pattern: programmes with disciplined QBR cadences pull 25 to 35% of total expansion ARR through the QBR loop, vs 5 to 10% for programmes without.
The QBR ROI Test
For a $20M ARR SaaS at 100% NRR (flat), installing a disciplined QBR framework on the top 50 enterprise accounts typically lifts NRR 8 to 15 percentage points within 12 months. That is $1.6M to $3M in incremental ARR per year on the same customer base. At a 5x revenue multiple, that is $8M to $15M in enterprise value created from a meeting cadence that already exists. QBR discipline is the highest-leverage investment in the enterprise retention layer.
The five-section QBR framework
A QBR that compounds NRR rather than wastes calendar time follows a five-section structure. Each section has a metric, an owner, and an expected output. Skip a section and the meeting collapses back into theatre.
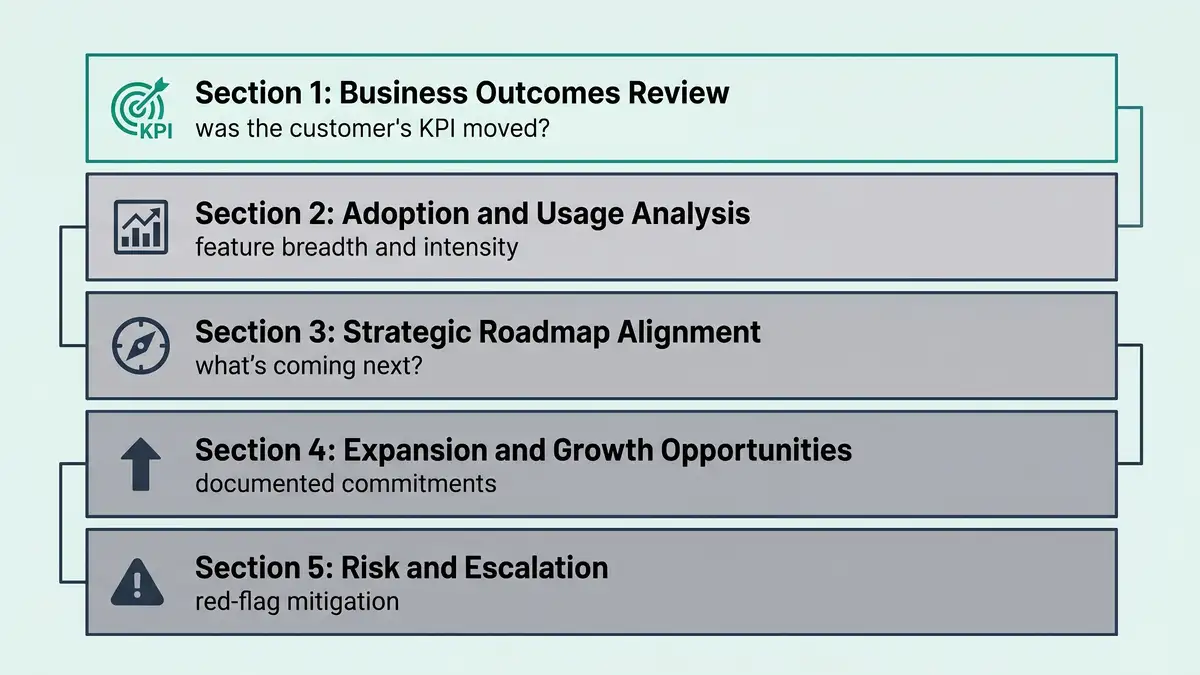
Section 1: Business outcomes review
The opening question: did the customer's KPI move? The QBR begins with the customer's business goals as defined at the previous QBR or at onboarding, with measured progress against them. Not vendor metrics (DAU/MAU on our product), but customer metrics (sales cycle reduced 18%, marketing-attributed pipeline up 32%). Top-decile programmes start every QBR with this section because it forces the conversation onto outcomes, not features.
Section 2: Adoption and usage analysis
Did the customer use what they paid for? Feature adoption depth, active seats, intensity of use, breadth across teams. Feature adoption strategy is the load-bearing input here. The QBR converts adoption telemetry into a strategic narrative: "you have 40% adoption depth; here's what the top-quartile reference customer in your industry looks like, and here's the gap to close." Vendor-side owner: CSM with product analytics input.
Section 3: Strategic roadmap alignment
What is the vendor shipping next quarter, and what does the customer need? This is not a generic product roadmap presentation. It is a curated subset of upcoming releases that map to the customer's documented goals, with timeline commitments and beta opportunities. Customers feel valued because the vendor is listening; vendors gain product feedback from real enterprise voice. Owner: CSM plus product manager on key strategic accounts.
Section 4: Expansion and growth opportunities
The commitment section. Top-decile programmes leave every QBR with a documented customer commitment about the next quarter's expansion or value milestone, plus a documented vendor commitment about the support to deliver it. Without this section, the QBR is reporting; with it, the QBR is engineered expansion revenue. Owner: CSM plus AE for upsell-eligible accounts.
Section 5: Risk and escalation
The closing section. Red-flag issues, mitigation owners, escalation paths, exec-level commitments where required. Most struggling accounts show stress signals in QBR conversations 30 to 60 days before they show up in customer health scores. Top-decile programmes treat Section 5 as the early-warning layer that prevents quiet churn. Issues raised here must have a documented owner and a 24-hour follow-up commitment, not "we'll get to it next quarter."

QBR cadence by ACV tier
QBR economics demand tier-aligned cadence. Running quarterly in-person QBRs on every customer is wasteful for SMB and inadequate for strategic enterprise. The right cadence depends on ACV, strategic value, and growth trajectory.
| Tier | QBR cadence | Format | Required participation |
| Strategic Enterprise (ACV $250K+) | Quarterly + monthly status | In-person + executive sponsor video | C-level customer + exec sponsor + CSM + AE + product |
| Enterprise (ACV $100K-$250K) | Quarterly | Video with on-site twice annually | VP-level customer + CSM + AE |
| Mid-Market (ACV $25K-$100K) | Quarterly automated + semi-annual live | Automated dashboard + bi-annual call | Director-level customer + CSM |
| SMB (ACV under $25K) | Annual or tech-touch | Automated email digest + on-demand | Account owner + tech-touch CSM |
Sources: Gainsight CS Guide 2026, ChurnCost ChurnZero vs Gainsight 2026, Userpilot CS Tools 2026.
The structural insight: most B2B SaaS programmes mis-tier their QBR motion by giving SMB the same quarterly attention as Enterprise. Top-decile programmes redeploy CSM capacity from SMB tech-touch automation into deeper strategic Enterprise QBRs, which is where the NRR uplift compounds.
The 2026 QBR tooling stack
Tooling does not produce QBR discipline, the framework does. But the right stack accelerates everything. Below is the 2026 QBR tooling map for $10M to $40M ARR B2B SaaS.
| Tier | Core stack | Annual cost | Best fit |
| SMB / scrappy ($1M-$10M ARR) | HubSpot Service Hub + Notion templates + Loom video | $5K-$15K | Under $10M ARR, <200 enterprise accounts |
| Mid-market ($10M-$40M ARR, Sarah Chen tier) | ChurnZero, Totango, or Vitally + Gong/Chorus for transcripts | $30K-$80K | $10M-$40M ARR, 200-1,000 enterprise accounts |
| Enterprise ($50M+ ARR) | Gainsight + Catalyst + Salesforce + dedicated CS Ops team | $120K-$400K+ | Multi-segment, multi-region, $50M+ ARR |
Sources: Pylon CS Tools 2026, Userpilot CS Tools 2026, Coworker AI CS Tools 2026.
The total tooling cost for a Sarah Chen tier ($10M to $40M ARR) is $30K to $80K annually, well within the NRR uplift envelope. Fanruan's enterprise CS dashboard analysis reinforces the point: the dashboard tooling matters less than the discipline of populating it weekly with customer-outcome data.
The seven-step QBR install methodology
Tier the account base by ACV and strategic value
Pull the customer base into Strategic Enterprise, Enterprise, Mid-Market, and SMB. Map ACV, growth trajectory, executive relationship strength, and reference-ability. Each tier gets a different QBR cadence and format. Failing this step produces a one-size-fits-none cadence.
Build the five-section QBR template
Standardize the deck and agenda across the CS org. Section 1 (Outcomes), Section 2 (Adoption), Section 3 (Roadmap), Section 4 (Expansion), Section 5 (Risk). Embed customer-specific KPI fields, adoption telemetry hooks, and commitment-capture sections. Gainsight's CS Guide documents the canonical structure.
Wire customer health and adoption telemetry
Section 2 of the QBR depends on real product usage data, not vibes. Connect Pendo, Mixpanel, Amplitude, or your in-house telemetry to the QBR template so adoption depth, feature breadth, and seat utilization auto-populate. The QBR becomes a strategic conversation about data, not a data-gathering meeting.
Train CSMs on commitment-driven facilitation
Section 4 (Expansion) and Section 5 (Risk) require facilitation skill, not slide-reading. Train CSMs to ask: "what is the one expansion commitment you're willing to make this quarter?" and "what is the one risk that would cause you to question renewal?" Top-decile CSMs leave every QBR with both commitments documented and signed off in writing.
Engineer C-level participation
QBRs without customer C-level participation are status meetings between middle managers. Guideflow's CS enablement research documents the gap: top-decile programmes get C-level participation in 60%+ of strategic enterprise QBRs vs 20% for median. Tactics: vendor-side exec sponsor invites, joint outcome-aligned agendas, calendar booking 90 days out, off-site venues for strategic accounts.
Instrument post-QBR analytics
QBR coverage rate, completion rate, commitment fulfillment rate, post-QBR NPS lift, QBR-driven expansion ARR. Fanruan's CS dashboard guide provides the canonical KPI structure. The metrics close the loop: QBRs that don't produce measurable outcomes get diagnosed and fixed in the next iteration.
Recalibrate quarterly
Customer behaviour drifts, product changes, and competitive moves shift the conversation. Top-decile programmes review the QBR template every 90 days, retire stale sections, refresh the customer-outcome KPI library, and update the expansion playbook. Programmes that ship a QBR template and never revisit it lose 8 to 12 percentage points of effectiveness annually.


Six failure patterns that destroy QBR programmes
Failure 1: Status-deck QBRs without commitments
The CSM walks through 12 slides of usage charts, the customer thanks them, the meeting ends. No commitments captured, no risks resolved, no expansion documented. Status-deck QBRs produce zero NRR uplift, and they consume CSM hours that could be invested in the next-best account. Every QBR must end with documented commitments from both sides.
Failure 2: Missing C-level customer participation
QBRs between middle managers are operational reviews, not business reviews. Without C-level customer participation, expansion conversations stall, strategic risks go unraised, and the vendor's exec sponsor has no counterparty. Engineering 60%+ C-level participation is the single highest-leverage shift in QBR effectiveness.
Failure 3: Stale agenda templates
The same five slides every quarter, the same product update, the same generic ROI calculation. Customers stop attending; CSMs stop preparing. Top-decile programmes refresh the template every 90 days based on what worked, what fell flat, and what the customer base now needs.
Failure 4: Ignoring product usage data
QBRs that don't reference real adoption telemetry are storytelling sessions. Section 2 (Adoption) must be data-driven: feature adoption depth, breadth across teams, intensity of use, gaps to industry peers. Without telemetry, the meeting becomes "I think you're doing well" instead of "your engineering team is at 22% adoption depth, here's the gap to your sales team's 67%."
Failure 5: "We'll get to it next quarter" deferrals
Section 5 (Risk) issues deferred to the next QBR are not resolved, they are accumulated. Top-decile programmes treat every Section 5 issue as 24-hour SLA: documented owner, documented resolution path, documented follow-up. Quiet churn is just a stack of deferred Section 5 issues that finally tipped over.
Failure 6: One QBR cadence for all account sizes
Running quarterly in-person QBRs for SMB customers wastes CSM capacity; running annual emails for strategic enterprise neglects the highest-NRR-leverage accounts. Tier the cadence to match ACV and strategic value. ABM retention strategy reinforces the same discipline: differentiated motion for differentiated value.
The 90-day QBR install plan
Days 1-30: Tier and template
Tier the customer base by ACV and strategic value. Build the five-section QBR template. Wire customer health and adoption telemetry into the template so data auto-populates. Define QBR coverage and commitment-fulfillment metrics. Output: tiered account list, QBR template ready, telemetry connected.
Days 31-60: Pilot on top 20 accounts
Run the new QBR template on the top 20 strategic enterprise accounts. Train CSMs on commitment-driven facilitation. Engineer C-level participation through joint exec-sponsor invites. Capture commitments and risks in writing. Output: 20 QBRs completed under the new framework, lessons documented.
Days 61-90: Scale and instrument
Roll out to the rest of the enterprise tier. Stand up post-QBR analytics dashboard. Begin tracking commitment fulfillment rate, post-QBR NPS, QBR-driven expansion ARR. Recalibrate template based on first-cohort lessons. Output: full enterprise QBR coverage, analytics live, recalibration cadence in place.
What "good" looks like at 12 months
- QBR coverage rate: 95%+ of enterprise accounts (vs 40 to 60% baseline).
- C-level customer participation rate: 60%+ on strategic enterprise QBRs (vs 20% baseline).
- Commitment fulfillment rate: 75%+ of customer commitments delivered the following quarter.
- QBR-driven expansion ARR: 25 to 35% of total expansion (vs 5 to 10% baseline).
- Enterprise NRR uplift: 8 to 15 percentage points (e.g., 105% to 118%).
- Logo retention on QBR-covered accounts: 92 to 96% (vs 70 to 80% on uncovered).
- Post-QBR NPS lift: 5 to 10 points sustained.
- Section 5 (Risk) resolution time: median under 24 hours (vs "next quarter" baseline).
Those deltas are the natural compounding of installing the five-section framework and recalibrating quarterly. The discipline reinforces the broader retention architecture: B2B customer retention strategy compounds when QBRs feed NRR, customer success metrics use QBR commitments as leading indicators, and SaaS churn analysis draws directly on Section 5 risk signals.
Want a diagnostic on whether your QBR motion is compounding NRR or just consuming CSM hours?
FAQ
What is a QBR in business?
A QBR (Quarterly Business Review) is a structured 60 to 90-minute meeting between a B2B SaaS vendor's customer success team and the enterprise customer's executive stakeholders, conducted every 90 days. The objective is to review business outcomes delivered, validate adoption against goals, align on the upcoming roadmap, capture expansion commitments, and surface risks. Best-in-class QBRs follow a five-section framework and end with documented commitments from both sides. Top-decile programmes drive 25 to 35% of total expansion ARR through the QBR loop and lift Enterprise NRR by 8 to 15 percentage points within 12 months.
What is a QBR meeting?
A QBR meeting is the quarterly business review session itself. For Strategic Enterprise accounts (ACV $250K+) it runs 90 minutes in-person or via video, with C-level customer participation, exec sponsor presence, and full CSM/AE/product alignment. For Enterprise (ACV $100K-$250K) it runs quarterly via video with on-site twice annually. Mid-market QBRs run quarterly automated plus semi-annual live; SMB runs annual or tech-touch. The meeting follows the five-section framework: business outcomes, adoption analysis, roadmap alignment, expansion commitments, risk and escalation.
What is a QBR in customer success?
In customer success, the QBR is the load-bearing retention mechanism for enterprise accounts. It is the quarterly checkpoint where the CSM validates that the customer's documented business goals are being achieved, captures expansion commitments, and surfaces risks 30 to 60 days before they escalate to churn. Gainsight's 2026 CS Guide documents that programmes with disciplined QBR cadences retain at 92 to 96% on covered accounts vs 70 to 80% on ad-hoc check-in accounts. The QBR is the highest-leverage instrument in the enterprise CS toolkit.
What should be included in a QBR?
The five-section framework: (1) Business outcomes review, did the customer's KPI move; (2) Adoption and usage analysis, real product telemetry vs goals; (3) Strategic roadmap alignment, curated upcoming releases mapped to customer goals; (4) Expansion and growth opportunities, documented commitments from both sides; (5) Risk and escalation, red-flag issues with 24-hour resolution SLAs. Skip a section and the QBR collapses into theatre. Include each section and the QBR compounds NRR.
How often should QBRs happen?
Tier-aligned cadence, applied with the same rigour as the underlying customer success automation: Strategic Enterprise (ACV $250K+) gets quarterly QBRs plus monthly status; Enterprise (ACV $100K-$250K) gets quarterly; Mid-Market (ACV $25K-$100K) gets quarterly automated plus semi-annual live; SMB (ACV under $25K) runs annual or tech-touch. Running uniform quarterly QBRs across all tiers wastes CSM capacity on SMB and starves Strategic Enterprise. Top-decile programmes redeploy SMB time savings into deeper Enterprise QBR engagement.
How is a QBR different from a status update meeting?
A status update is a one-way information transfer; a QBR is a two-way commitment exchange. Status updates produce slide reviews, action item lists, and "we'll follow up" deferrals. QBRs produce documented expansion commitments from the customer, documented support commitments from the vendor, and 24-hour resolution SLAs on raised risks. The structural difference: every QBR ends with a written commitment loop signed by both parties; status updates end with handshakes and no signed paper.
What is the ROI of QBR programmes?
Typical 12-month payback: $30K to $80K invested in tooling and CSM enablement returns 8 to 15 percentage points of Enterprise NRR lift, equivalent to $1.6M to $3M in incremental ARR on a $20M base. At 5x revenue multiples, that is $8M to $15M in enterprise value created from a meeting cadence that already exists. Bain's retention economics research shows the structural payoff: 5pp retention lift drives 25 to 95% profit improvement, and QBRs are the operational instrument that produces that lift.
What tools do you need for QBRs?
For $10M to $40M ARR B2B SaaS: ChurnZero, Totango, or Vitally for CS platform ($30K to $80K/year), Gong or Chorus for transcripts and recordings, Pendo or Mixpanel for adoption telemetry, Salesforce or HubSpot for account data. Smaller orgs use HubSpot Service Hub plus Notion templates plus Loom video ($5K to $15K). Enterprise uses Gainsight plus Catalyst plus Salesforce ($120K to $400K+). Tooling does not produce QBR discipline, the framework does.
Architect a QBR motion that compounds Enterprise NRR, not one that fills calendars with slide recitals.
peppereffect installs end-to-end QBR operating systems for $10M to $40M ARR B2B SaaS: the five-section framework, the tier-aligned cadence, the commitment-driven facilitation, the C-level participation engineering, the post-QBR analytics. Logic-gated execution, not retainer hours.
Resources
- Gainsight, The Essential Guide to Customer Success
- Userpilot, Best Customer Success Tools 2026
- ChurnCost, ChurnZero vs Gainsight 2026
- Pylon, 10 Essential Customer Success Tools 2026
- Coworker, Best AI Tools for Customer Success 2026
- Fanruan, Enterprise Customer Success Dashboard
- Guideflow, Customer Success Enablement Guide 2026
- ALM Corp, Client Onboarding 17-Step Checklist
- Optif, B2B SaaS NRR Benchmarks 939 Companies
- McKinsey, NRR Advantage in B2B Tech
- Bain, Customer Retention Economics
- Gainsight, QBR Template and Best Practices
- ChurnZero, QBR Best Practices
- Totango, QBR Customer Success Guide
- Catalyst, QBR Framework and Templates
- Planhat, Customer Success QBR Best Practices
- HubSpot, Quarterly Business Review Guide
- OpenView, 2026 SaaS Benchmarks Report