

SaaS margins are the engineered output of an operating model — not a residual that emerges if growth holds. Median public SaaS gross margin sits at 75–78%, top quartile clears 80%, and the cohort stuck at 65–72% is paying for hidden cloud waste, miscategorized customer-success cost, and AI-feature COGS that never made it into the unit economics model. Operating margins have shifted from "negative is acceptable for growth" to "show me the path to 20%+ before I write the cheque." Free Cash Flow margin has displaced reported EBITDA as the metric Series C investors actually trust. If your gross margin is below 75% at $10M+ ARR, the killer is structural, not cyclical — and it is hiding in five specific places this article will name.
This is the diagnostic playbook: the four margin definitions investors actually parse (gross / operating / EBITDA / FCF), the 2024–2026 mid-market and public-company benchmarks, the COGS decomposition every CFO must own line-by-line, the five silent margin killers that compound below the noise floor, and a 90-day diagnostic install that exposes them. Built for CEOs who refuse to confuse "margins are tight this quarter" with the structural problem they actually represent.
The Four Margin Definitions That Actually Matter

Margin is not a single number. A board-grade financial conversation parses four distinct margin layers, each with a different diagnostic purpose. Gross margin measures unit economics on the product itself — revenue minus the variable cost of delivering each subscription dollar. Operating margin measures the efficiency of the entire go-to-market and product engine — gross profit minus S&M, R&D, and G&A. EBITDA margin strips out interest, taxes, depreciation, and amortization to reveal cash-generative capacity. Free cash flow margin is what your investors actually trust — operating cash flow minus capex, divided by revenue, with no GAAP gymnastics. The 2026 investor consensus has shifted decisively toward FCF margin as the only margin number that resists creative accounting.
Most mid-market CEOs report gross margin and call it done. The board reads gross margin and immediately asks for operating margin to test whether S&M is bloated. The investor reads operating margin and demands FCF margin to test whether GAAP is masking real cash burn. ICONIQ's 2025 State of Software documents the shift: among the top-quartile public SaaS cohort, FCF margin disclosure quality is now a leading indicator of valuation multiple.
The Four-Margin Test
If you can produce gross / operating / EBITDA / FCF margins in seconds — by month, by cohort, by ACV segment — your model is investor-grade. If the four numbers are not connected by explicit linkage in your SaaS financial model, the four margins are not yet a system.
Want to see your own CAC against peer benchmarks? Run the CAC Diagnostic for your true CAC, the 30 to 50% reduction agentic deployment delivers, and a board-ready PDF in 60 seconds.
Run the CAC Diagnostic2024–2026 Margin Benchmarks: Public, Private, By ACV
Margins do not float free of company structure. They correlate deterministically with ACV cohort, growth stage, and operating model. The benchmark to compare yourself against is your specific cohort — not the broad SaaS aggregate.
| Cohort | Gross Margin | Operating Margin | FCF Margin |
| Enterprise (>$250K ACV) | 80-85% | 20-30% | 20-30% |
| Mid-Market ($10K-$100K ACV) | 75-80% | 10-20% | 8-15% |
| SMB (<$10K ACV) | 72-78% | 5-15% | 3-10% |
| AI-Native (compute-heavy) | 55-70% | varies — growth stage | often negative |
| Mixed-Service SaaS | 65-72% | 8-15% | 5-10% |
Sources: Benchmarkit 2025, ICONIQ State of Software 2025, CFO Pro Analytics — Gross Margin Targets, G-Squared CFO 2026 Benchmarks, Lighter Capital 2025 B2B SaaS Benchmarks.
Public SaaS 2025 Margin Disclosures
| Company | Gross Margin | Operating Margin | FCF Margin |
| Cloudflare (Q4 FY2025) | ~77% | ~13% non-GAAP | ~25% |
| Datadog (FY2025) | ~80% | ~24% non-GAAP | ~31% |
| HubSpot (FY2025) | ~85% | ~17% non-GAAP | ~20% |
Sources: Cloudflare Q4 FY2025 results, Datadog Q4 FY2025 results, HubSpot Q4 FY2025 8-K.
The implication for a $10M-$40M ARR mid-market company is direct. If your gross margin is 72% and your enterprise mix is north of 50%, you are tracking 8-13 points below cohort median — a structural architecture problem, not a market saturation story. If your FCF margin is negative at the same scale, your operating model is consuming capital faster than it converts subscription revenue into cash. The diagnosis sits one layer above your SaaS unit economics framework — margin is the ceiling, unit economics determine the slope.
The 4 Pillars Playbook breaks down the entire framework with deployment maps, KPIs, and real case studies across SaaS, recruiting, and coaching.
Open the Interactive PlaybookThe COGS Decomposition Every CFO Must Own
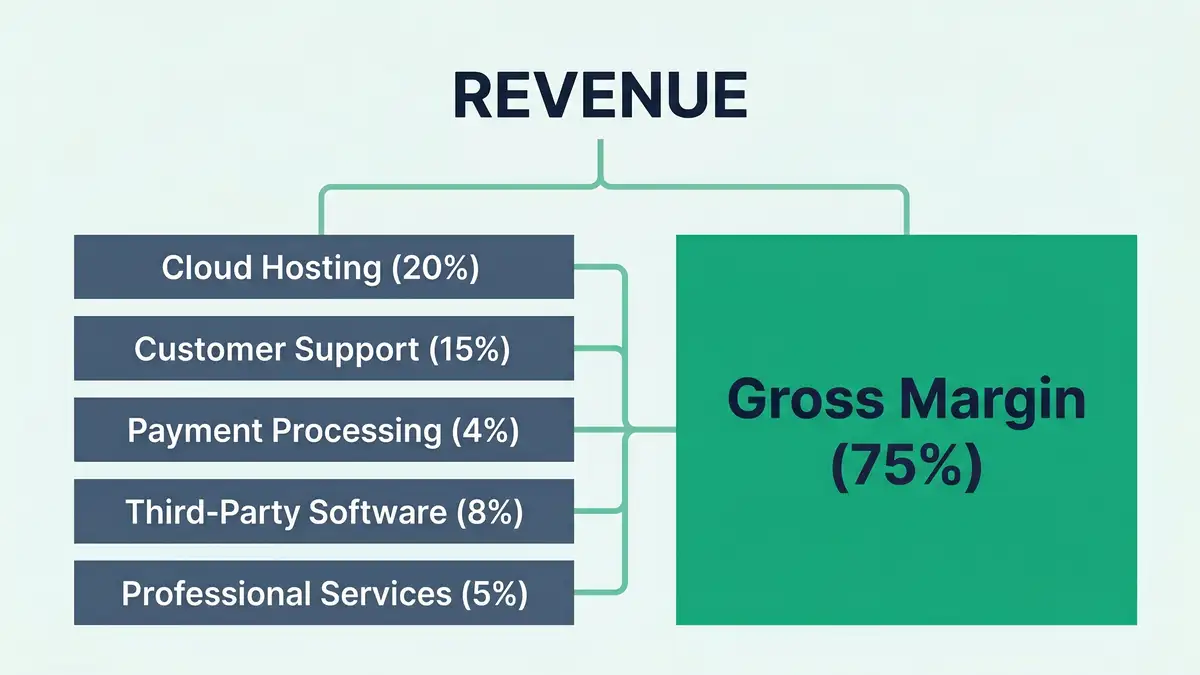
SaaS COGS is not a single line. It decomposes into five components, each with its own benchmark and margin-killer profile. The CFO who cannot explain each line item by % of revenue is the CFO whose gross margin is silently eroding.
| COGS Component | Healthy % of COGS | Common Killer |
| Cloud Hosting (AWS / Azure / GCP) | 15-25% | Idle compute, over-provisioning, multi-cloud sprawl |
| Customer Support / Success | 10-20% | Loaded into S&M instead of COGS — flatters gross margin 3-5pp |
| Payment Processing | 3-5% | Stripe/Adyen 2.9-3.5% per transaction; FX leakage adds 1-2% |
| Third-Party Software (data, AI APIs, observability) | 5-15% | AI feature COGS — quietly destroys margin |
| Professional Services Delivery | 5-15% | Mixed-services drags gross margin 5-10 points |
Sources: The SaaS CFO — AI Feature Margin Risk, Stripe — Payment KPIs & Revenue Leakage, G-Squared CFO — Gross Margin by Cohort.
Five Silent Margin Killers That Compound Below the Noise Floor

The killers do not announce themselves. They erode margin 50-200 basis points per year, masked by topline growth, until renewal cycles or fundraising due diligence force the disclosure.
Killer 1 — AI-Feature Compute Cost
AI features bundled into existing SaaS tiers add 5-15 percentage points of COGS that never get re-priced. The SaaS CFO documents the pattern: a 78% gross margin product launches an AI feature, compute cost lands in COGS, gross margin drifts to 71% over 18 months without anyone noticing because revenue is growing 40%+. The fix: hybrid pricing or usage-based monetization on AI features specifically — see the B2B pricing strategy playbook for the structural decision tree.
Killer 2 — Customer Success Mis-Classification
Where Customer Success cost lives — COGS or S&M — moves reported gross margin by 3-5 percentage points. The 2026 trend, per Subscript and modern SaaS CFO practice, is COGS classification when CS is post-sale account management; S&M when CS is expansion-driving. Most mid-market companies default to S&M and overstate gross margin to the board.
Killer 3 — Cloud Cost Sprawl
Idle compute, over-provisioned regions, multi-cloud redundancy, and unmonitored auto-scaling consume 10-30% of cloud spend at most $10M-$40M ARR companies. FinOps maturity below "managed" routinely leaks 200-500 bps of gross margin. FinOps roles are now standard at $30M+ ARR precisely because the killer compounds undetected.
Killer 4 — Payment Processing & FX Leakage
Stripe and Adyen charge 2.9-3.5% per transaction; international payments add 1-2% in FX losses; failed payments and dunning gaps absorb another 0.5-1%. Net realized revenue is routinely 3-5% lower than booked revenue at SaaS companies that have not engineered payment infrastructure. Stripe's own data documents the leakage.
Killer 5 — Oversized G&A and R&D Drag
G&A creeps from a healthy 10-12% to 15-18% as finance, HR, and legal headcount scales linearly with company size. R&D capitalization games (capitalizing internal-use software) flatter near-term margin but trigger investor skepticism in DD. SchlottCo's 2025 analysis shows mid-market SaaS routinely overspending G&A by 30-50% relative to top-quartile peers.
Diagnose where your hidden margin killers are leaking 200-500 basis points per year.
Book a Margin Diagnostic CallThe Operating Expense Structure That Hits Rule of 40
Margins do not exist in isolation. They sit inside the Rule of 40 envelope (Growth + Margin = 40+) and inside the operating-expense structure that determines every other unit-economics line. The 2026 mid-market norm:
S&M: 35-50% of Revenue (compressing)
Healthy mid-market range. SaaSGrid's public SaaS S&M index shows the median compressing 5-10 points YoY as agentic AI displaces SDR overhead and lifts conversion on existing pipeline. Companies above 55% are over-investing or have weak conversion rates.
R&D: 20-35% of Revenue
Mid-market norm. AI-native companies push R&D efficiency higher (smaller engineering teams, larger output). R&D capitalization games — moving internal-use software development to balance sheet — distort apparent operating margin and trigger DD scrutiny.
G&A: 10-15% of Revenue
Healthy range — declining as automation scales finance/HR/legal. Companies above 18% are over-staffed or carrying duplicate roles post-acquisition.
Result: Operating Margin Path
Gross 78% − S&M 42% − R&D 28% − G&A 12% = -4% operating margin (typical $20M ARR growth-stage). The path to 20%+ operating margin requires concurrent S&M compression (agentic AI), R&D leverage (automation in product itself), and G&A discipline. See the Rule of 40 deep-dive for the full balance equation.
Agentic AI as the Margin Multiplier

The 2025-2026 inflection in SaaS margins is agentic. Autonomous customer support agents reduce CS COGS 30-50%; agentic SDRs collapse S&M cost per qualified lead by 60-85%; AI-driven FinOps tools find 15-25% cloud waste in 60 days; agentic G&A automation cuts finance/HR overhead 20-30%. The aggregate margin lift over 12 months at a $10M-$40M ARR company running concurrent deployment is 400-800 basis points of operating margin — without compromising growth rate.
The structural shift is from cost-as-headcount to cost-as-orchestration. Your Customer Success automation stack collapses CS COGS; your Sales Automation architecture compresses S&M; your agentic workflow orchestration plus CRM automation spine compresses G&A. The aggregate effect: a previously 5% operating margin company crosses into 12-15% within four quarters of disciplined deployment.
The 90-Day Margin Diagnostic Install

The diagnostic does not need a six-month consulting engagement. It needs disciplined sequencing across three thirty-day sprints.
| Days | Focus | Outcome |
| 1-30 | COGS decomposition: line-by-line by % of revenue; benchmark each against cohort median | Margin gap by component identified; killers ranked |
| 31-60 | Top-3 killer remediation: FinOps cloud audit, CS classification fix, payment infrastructure review | 200-500 bps gross margin recovery in flight |
| 61-90 | Operating expense audit: S&M / R&D / G&A vs cohort median; agentic deployment roadmap | Operating margin path to 15-20% within 12 months |
Sources: G-Squared CFO Cohort Gross Margin, ICONIQ State of Software 2025.
Bottom Line
SaaS margins are the engineered output of an operating model — not a residual. The four margin definitions (gross / operating / EBITDA / FCF) are diagnostic layers, not interchangeable numbers. The 2024-2026 benchmarks are deterministic by ACV cohort, and the cohort-relative position is what matters — not the broad SaaS aggregate. The five silent killers (AI-feature COGS, CS misclassification, cloud sprawl, payment leakage, oversized G&A) compound 200-500 bps per year below the noise floor of topline growth, and the only defense is disciplined COGS decomposition with cohort benchmarking. Agentic AI is the margin multiplier that compresses S&M, R&D efficiency, and G&A simultaneously — delivering 400-800 bps of operating margin lift in 12 months at $10M-$40M ARR with concurrent deployment. The CEO's job is not to defend margins quarterly. It is to install the operating system that compounds them.
Install the Margin Operating System
peppereffect runs the 90-day margin diagnostic on $10M-$40M ARR B2B SaaS — COGS decomposition, killer remediation, agentic AI deployment for S&M / R&D / G&A compression. Architectural, not advisory. Outcomes target: 200-500 bps gross margin recovery and 400-800 bps operating margin lift within 12 months.
Book Your Growth Mapping CallSee the SaaS Financial Model architecture →
Frequently Asked Questions
What's a good gross margin for a SaaS company?
The 2026 median public SaaS gross margin is 75-78%. Top quartile clears 80%+. Enterprise-heavy SaaS (>$250K ACV) routinely hits 80-85%; mid-market 75-80%; SMB 72-78%. AI-native companies with compute-heavy COGS often run 55-70%. If your gross margin is below your cohort median, the issue is structural — usually one of the five silent killers, not market dynamics.
What's the difference between gross margin and operating margin?
Gross margin = (Revenue − COGS) / Revenue. It measures product unit economics. Operating margin = (Revenue − COGS − S&M − R&D − G&A) / Revenue. It measures the efficiency of the entire business. A SaaS company can have 80% gross margin and -10% operating margin if S&M is bloated. Both numbers must be reported and tracked separately.
Should Customer Success cost be in COGS or S&M?
Modern SaaS CFO practice (per Subscript, The SaaS CFO, and most 2026 board-grade financial models) classifies post-sale account-management CS as COGS and expansion-driving CS as S&M. Misclassification flatters reported gross margin by 3-5 percentage points and triggers investor scrutiny in DD. Pick the right classification and apply it consistently.
Why are AI features destroying SaaS gross margins?
AI features bundled into existing tiers add 5-15 percentage points of compute COGS that never get re-priced. The cost lands in COGS but the price stays flat — gross margin drifts down 200-500 bps per year. The fix is hybrid pricing or usage-based monetization on AI features specifically, not bundling them into existing seat licences.
What's a healthy operating margin for $10M-$40M ARR mid-market SaaS?
Growth-stage mid-market SaaS often runs at -5% to +10% operating margin while investing heavily in S&M for growth. The path to 15-20% by $50M ARR is the standard board ambition. FCF margin should track operating margin within 3-5 points; a wider gap signals working capital issues or aggressive accounting.
How does payment processing affect SaaS net realized revenue?
Stripe and Adyen charge 2.9-3.5% per transaction; international payments add 1-2% FX leakage; failed payments and dunning gaps absorb another 0.5-1%. Net realized revenue is routinely 3-5% below booked revenue at SaaS companies that have not engineered their payment infrastructure. The fix is dunning automation, multi-processor routing, and FX hedging at the company level.
Can agentic AI lift SaaS operating margin?
Yes — measurably. 2025-2026 deployments document 400-800 bps of operating margin lift over 12 months from concurrent agentic deployment across CS (autonomous support reducing CS COGS 30-50%), S&M (agentic SDR compressing cost per qualified lead 60-85%), and G&A (finance/HR automation cutting overhead 20-30%). The lift is structural, not cyclical.
Resources
- Benchmarkit — 2025 SaaS Performance Metrics
- ICONIQ — State of Software 2025
- G-Squared CFO — SaaS Benchmarks 2026
- G-Squared CFO — Calculate SaaS Gross Margin by Cohort
- CFO Pro Analytics — Gross Margin Targets for SaaS
- Lighter Capital — 2025 B2B SaaS Startup Benchmarks
- The SaaS CFO — AI Feature Margin Risk
- Stripe — Payment KPIs & Revenue Leakage
- Cloudflare Q4 FY2025 Results
- Datadog Q4 FY2025 Results
- HubSpot Q4 FY2025 8-K
- SchlottCo — SaaS CFO G&A Overspend 2025
- SaaSGrid — S&M % of Revenue Index
- LucidLink — Director of Cloud Cost Optimization (FinOps reference)
- Kalungi — Why SaaS Multiples Are Compressing 2026
- Limelight — 15 Essential SaaS Financial Metrics 2026


