

B2B conversion rate optimization in 2026 is the systematic discipline of compounding small lifts across every funnel stage — visitor-to-lead, lead-to-MQL, MQL-to-SQL, SQL-to-close — into asymmetric revenue gains. Sarah Chen-style mid-market SaaS founders run "CRO" as occasional homepage A/B tests, miss the architectural truth that a 0.5pp lift on each of four funnel stages compounds to 25-40% more closed-won ARR, and spend budget on traffic acquisition that the conversion engine can't absorb. The fix is architectural: install a seven-step CRO programme (audit → research → hypothesise → prioritise → test → analyse → iterate), wire it into a quarterly experiment cadence with a hypothesis log, and switch the headline metric from individual test wins to compounding revenue per visitor. This playbook walks the 2026 conversion benchmarks, the seven-step programme architecture, the funnel-stage CRO levers, and a 90-day rollout that lifts revenue per visitor 25-50% without buying a single new visitor.
The peppereffect view
B2B CRO is not homepage testing — it is the compounding discipline of multi-stage funnel optimisation. Architect the programme as seven repeatable steps, prioritise tests using PIE/ICE scoring, demand statistical significance for declared wins, log every learning regardless of outcome, and measure success in revenue-per-visitor lift, not individual test wins. Tools matter least; testing discipline matters most.
What B2B CRO actually is in 2026
B2B conversion rate optimization is the systematic practice of lifting conversion rates at every stage of the buyer funnel through hypothesis-driven testing. The 2018 version was "test the homepage button colour." The 2026 version is a multi-stage architecture: audit current funnel performance, research user behaviour with quantitative analytics and qualitative session replay, hypothesise specific changes tied to documented friction points, prioritise tests by potential impact and implementation ease, run statistically significant A/B experiments, analyse lift by segment and intent, and iterate winners into the production experience while logging every learning.
The architectural rewrite follows three structural shifts. First, the funnel stages multiplied. CRO now spans five stages — visitor-to-lead, lead-to-MQL, MQL-to-SQL, SQL-to-opportunity, opportunity-to-closed-won — and a 0.5pp lift on each stage compounds to 25-40% more revenue, even though no individual test feels dramatic. Second, the data infrastructure deepened. Session-replay tools (Hotjar, FullStory, Microsoft Clarity), heatmaps, and form-abandonment analysis now reveal friction patterns that traditional analytics miss entirely. Third, AI-driven personalisation matured. Dynamic content, predictive personalisation, and ML-segmented experience optimisation lift conversion 8-22% above static A/B tests for ICP-segmented traffic.
The compounding effect: B2B SaaS median visitor-to-lead conversion sits at 2.35%, while top-decile sites convert at 11.45%. The 5x performance gap is almost entirely engineering, not lead quality. Programmes running disciplined CRO close 60-80% of that gap within 12-18 months. Pair the discipline with the wider inbound marketing for SaaS playbook so the traffic feeding the funnel is high-fit in the first place.
The "test the button" trap
"We A/B test our CTAs" is not a CRO programme. Single isolated tests without methodology, statistical significance, or hypothesis logging produce noise. The 2026 best practice runs 6-12 statistically significant experiments per quarter, documents every learning regardless of outcome, and feeds findings back into the architectural design. Programmes running <3 disciplined tests per quarter rarely beat the median.
The seven-step CRO programme architecture
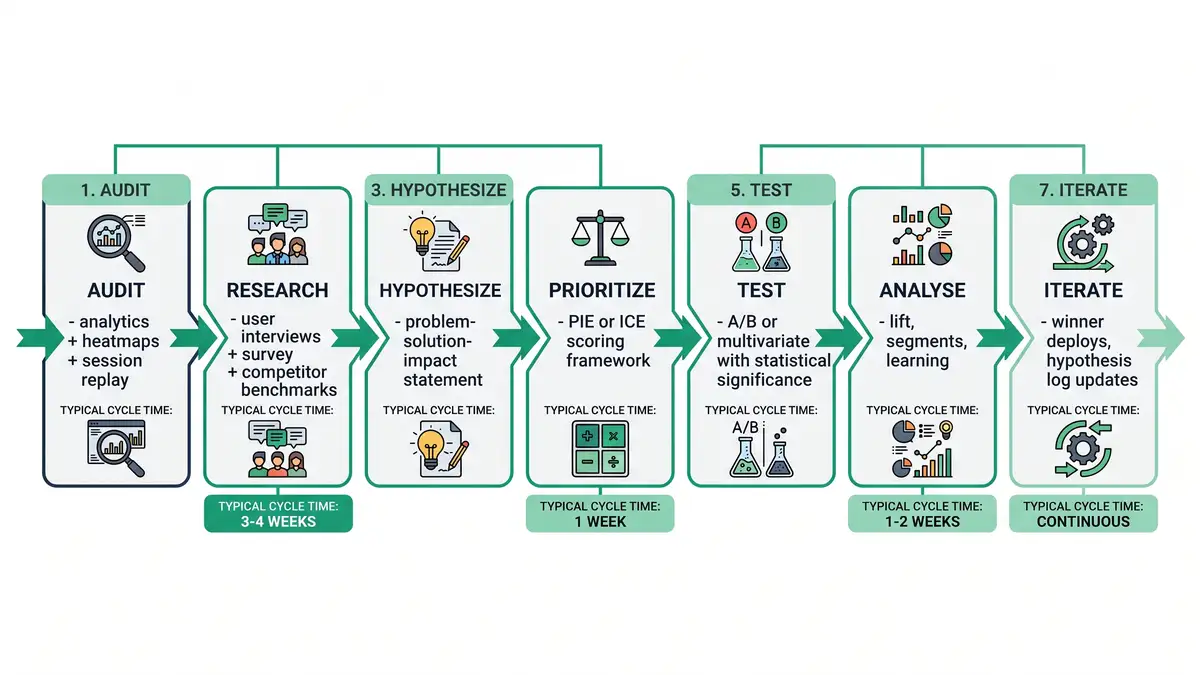
Every defensible 2026 CRO programme runs seven repeatable steps. Each step has a documented input, output, and time budget. Skip a step and you fall back to "test the button" guesswork.
Audit — current funnel performance
Pull last 90 days of analytics. Build the conversion-by-stage table: visitor-to-lead %, lead-to-MQL %, MQL-to-SQL %, SQL-to-opportunity %, opportunity-to-closed-won %. Layer heatmaps (Hotjar, Microsoft Clarity) and session replay (FullStory) on the top 10 highest-traffic pages. Identify the lowest-converting stage as priority. Time budget: week 1.
Research — user behaviour and friction
Run 5-8 user interviews with recent customers and lost prospects. Pull form-abandonment funnels. Survey visitors with one-question intercepts ("What stopped you?"). Benchmark against 3 direct competitors. Document friction points with quantitative evidence. Time budget: week 2-3.
Hypothesise — specific testable claims
Convert friction points into testable hypotheses using the format: "We believe [change] will lift [metric] by [magnitude] for [segment] because [evidence]." Examples: "Replacing 11-field form with 4-field progressive profile will lift demo-request rate 30%+ for SMB visitors because Hotjar shows 47% form abandonment at field 6." Time budget: week 3-4.
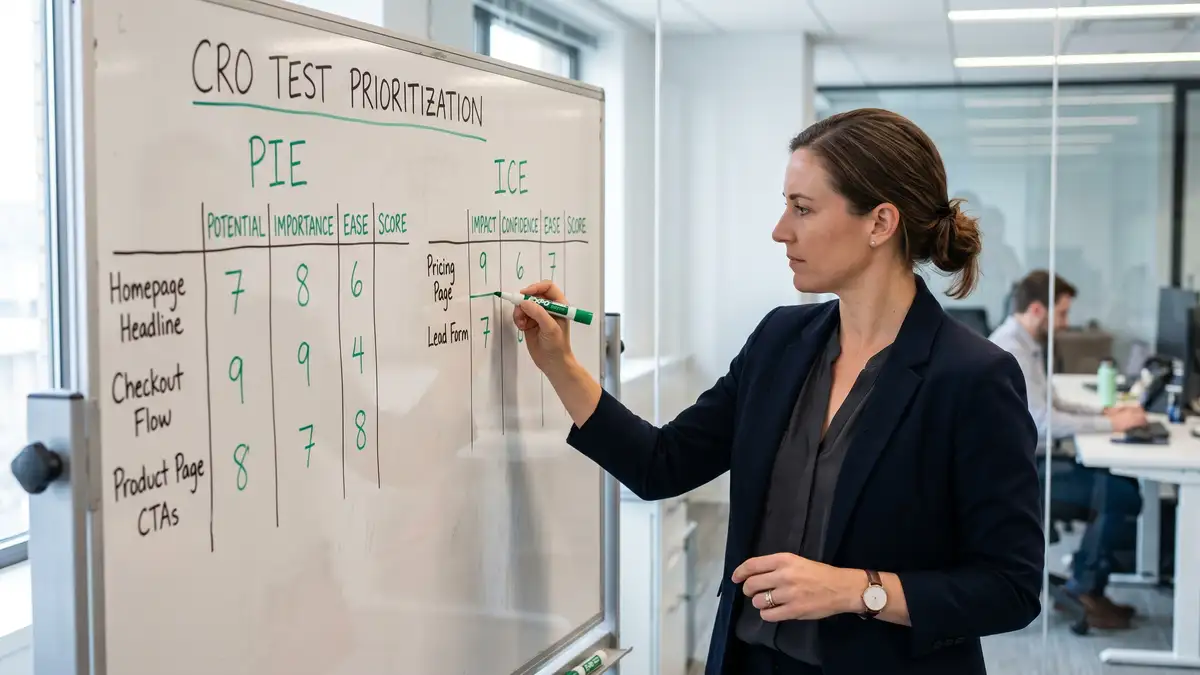
Prioritise — PIE or ICE scoring
Score each hypothesis on three dimensions. PIE: Potential lift × Importance to revenue × Ease of implementation (1-10 each, average). ICE: Impact × Confidence × Ease. Run the top 3-5 hypotheses by score. Reject "interesting but low-impact" tests. Time budget: week 4.
Test — statistically significant A/B
Run A/B (or multivariate) experiments using VWO/Optimizely sample-size calculators to establish minimum sample for 95% confidence. B2B traffic is lower than B2C — typical mid-market test runs 14-28 days for significance. Don't peek; don't stop early. Time budget: 2-4 weeks per test.
Analyse — lift by segment and intent
Calculate overall lift, then segment by traffic source, ICP fit, device, and intent stage. A test showing flat aggregate lift may show 20%+ lift on tier-1 ABM accounts and -5% on out-of-ICP — deploy the winning variant only to the segment where it lifts. Document every result, including null findings. Time budget: week after test completes.
Iterate — winner deploys, learnings log
Deploy winning variants. Update the hypothesis log with outcomes. Identify follow-on tests building on winners (and on losers — null results are signal too). Feed learnings into broader design system. Repeat from step 1 quarterly. The compounding effect comes from treating CRO as a continuous programme, not a one-off project.
The 2026 B2B SaaS conversion benchmarks
Powered by Search's funnel benchmarks and Prospeo's 2026 conversion data agree on the central numbers. B2B SaaS median visitor-to-lead conversion sits at 2.35%. Top-quartile programmes hit 5-8%. Top-decile sites convert at 10%+. The performance gap is what compounds into asymmetric revenue.
The math: a $10M ARR SaaS attracting 100,000 visitors per quarter at $30k ACV with current 2.35% conversion produces 2,350 leads. Lift to 5% (top-quartile) and you produce 5,000 leads. At 13% MQL→SQL conversion and 25% close rate, that's 162 closed deals quarterly versus 76 — $2.5M ARR difference per quarter on the same traffic. Conversion lifts are revenue lifts.
| Funnel stage | Median | Top quartile | Top decile |
| Visitor → Lead | 2.35% | 5-8% | 10%+ |
| Lead → MQL | 37-41% | 50%+ | 60%+ |
| MQL → SQL | 13-32% | 40-50% | 55%+ |
| Demo → Opportunity | 30-40% | 50%+ | 60%+ |
| Opportunity → Closed Won | 20-30% | 35-45% | 50%+ |
Source: SaaSHero — 2026 SaaS Conversion Benchmarks; Powered by Search — Funnel Benchmarks; Prospeo — B2B Conversion Rates 2026
The MQL and SQL definitions feeding these stages tie directly to our marketing qualified lead framework and the wider lead scoring playbook — without those gating criteria, conversion rates collapse into MQL volume vanity.
The four highest-leverage CRO levers

Not all CRO levers are equal. The Pareto distribution applies — four levers consistently account for 70-80% of conversion lift in B2B SaaS programmes. Prioritise them before testing anything below the line.
Above-the-fold clarity — H1, hero CTA, social proof
The first viewport (above the fold) accounts for 57% of total visitor attention. Most B2B sites waste it on generic value props, vague CTAs, and zero social proof. Above-the-fold optimisation typically lifts visitor-to-lead conversion 18-35%. Test: outcome-driven H1 ("Cut sales cycle 20% in 90 days") vs feature-driven, single high-contrast CTA, customer logo bar within hero, specific quantified benefit.
Form optimisation — fewer fields, progressive profiling
Each additional form field reduces submissions 4-7%. Forms beyond 5 fields typically see 40-50%+ abandonment. Progressive profiling — capturing additional fields across multiple touchpoints rather than one form — lifts demo-request conversion 30-60%. Combine with autofill, smart defaults, and inline validation. The 11-field form is the silent killer of mid-market B2B conversion.
Pricing page architecture — anchor + comparison + clear CTA
67% of B2B buyers visit a pricing page before booking a demo. High-converting SaaS pricing pages use three patterns: anchor pricing (highest tier visible to make middle tier feel reasonable), feature-comparison tables with clear differentiation, and stage-specific CTAs ("Start free trial" for SMB, "Talk to sales" for enterprise). Pricing page optimisation typically lifts demo-request rate 22-45%.
Trust signals — testimonials, case studies, security
Trust signal density on the conversion path lifts conversion 15-30%. The high-leverage trust signals: customer logo bar above the fold, video testimonials adjacent to demo CTA, named-customer case studies on pricing page, security badges (SOC2, ISO27001) near contract-related CTAs, specific quantified outcomes ("Used by 247 mid-market SaaS companies").
Demo page CRO: the highest-stakes single page

The demo request page is the single highest-stakes CRO surface in B2B SaaS — every percentage point lift converts directly to AE-meeting volume. Top-quartile demo pages deploy seven specific patterns: async scheduling embedded inline (Calendly/Chili Piper) rather than a contact-us form that promises follow-up, progressive profiling capturing only 4-5 fields with role and team-size as priority, expectation-setting copy ("30-min call covering your specific pipeline challenges"), customer-quote social proof adjacent to scheduler, demo-content preview thumbnail, mobile-optimised scheduler, and instant-confirmation page with calendar invite.
The compounding effect: a B2B SaaS attracting 5,000 demo-page visits/quarter at 18% baseline conversion produces 900 booked demos. Lifting demo conversion to 36% (top-quartile) produces 1,800 booked demos — same traffic, double the AE meetings. Pair with our deeper B2B landing page optimization playbook and the sales pipeline management framework that turns booked demos into closed-won revenue.
Mobile-first CRO: the 2026 non-negotiable
53% of B2B research traffic now starts on mobile devices, but most B2B sites are still designed mobile-second. Discovered Labs' mobile CRO data shows mobile conversion rates lag desktop by 30-50% in B2B contexts — almost entirely due to UX friction, not buyer-readiness differences. The fix: design for thumb-zone CTAs, single-column layouts, sticky bottom CTAs, mobile-first form fields with appropriate input types, accelerated page-load (under 2.5s LCP), and mobile-specific demo-scheduling flows.
Mobile CRO is not optional polish — it is half the funnel. Programmes that deploy desktop-first design and add mobile responsiveness as an afterthought systematically under-convert 30-50% of their qualified traffic. The 2026 baseline: mobile conversion rate within 80% of desktop conversion rate. Below that ratio indicates structural mobile UX problems.
The five failure modes that kill CRO programmes
Failure mode 1: Single tests without statistical significance
Declaring "the green button won" after 3 days and 200 visitors is not a CRO win — it's noise being mistaken for signal. B2B traffic is lower than B2C, so most tests need 14-28 days for 95% confidence. Use sample-size calculators upfront; don't peek mid-test; don't stop early. Spike's common CRO mistakes data shows premature winner declaration is the #1 cause of CRO programmes producing zero compounding revenue.
Failure mode 2: No hypothesis log
Running tests without documenting hypothesis, outcome, and learning loses 60-80% of programme value. Every test — winner, loser, or null — produces information about your buyers and your funnel. Without a hypothesis log, the same test gets re-run 18 months later by a different person who doesn't know it failed before.
Failure mode 3: Testing without research
Hypotheses pulled from "best practice" articles instead of user research produce 5-8% test win rates. Hypotheses derived from session replay, user interviews, and form-abandonment analysis produce 25-40% test win rates. Skip the research phase and you're testing other companies' problems, not yours.
Failure mode 4: Optimising for vanity conversions
Lifting visitor-to-lead conversion 50% by removing form fields produces a flood of low-fit leads — top of the funnel improves while pipeline contribution collapses. Always measure CRO lift downstream: visitor-to-MQL, visitor-to-SQL, and visitor-to-closed-won, not just visitor-to-lead. Pair the analysis with our B2B marketing attribution framework.
Failure mode 5: Tool-led CRO without programme discipline
Buying VWO or Optimizely without instituting the seven-step programme produces dashboards nobody references. Tools matter least; testing discipline matters most. The 2026 best practice runs disciplined CRO with simpler tools (Microsoft Clarity is free) before considering enterprise platforms.
How AI personalisation changes CRO economics

AI integration in CRO is now production-grade across three layers. Predictive personalisation (Mutiny, Path Factory, HubSpot Breeze) lifts conversion 8-22% by serving ICP-specific content variants at first visit. Dynamic A/B testing (VWO Insights, Optimizely Recommendations) auto-shifts traffic toward winning variants mid-test, compressing significance time 30-40%. Conversational AI on conversion paths — chatbots and intent-detecting forms — lifts demo-request conversion 12-25% in tier-1 ABM segments. AI personalisation earns its cost only when integrated into the broader CRO programme; deploying it without testing discipline produces dashboards instead of revenue.
The economics: traditional CRO programmes cost $40k-$80k/year in tooling and 0.5-1.0 FTE in CRO/UX time. AI-augmented programmes drop the FTE to 0.25 and lift programme output 50-100%. Combined with broader agentic workflows patterns, the 9-12 month payback math becomes asymmetric in favour of disciplined adopters.
The infrastructure spine: tooling, governance, cadence
Tooling stack. The minimal viable 2026 CRO stack: analytics (GA4 + HubSpot/Salesforce CRM), session replay (Microsoft Clarity — free — or FullStory), heatmaps (Hotjar), A/B testing (VWO, Optimizely, or Convert), survey/intercept (Hotjar surveys, Typeform). Total annual cost for mid-market: $8k-$25k. Enterprise tier (Optimizely Web Experimentation + FullStory + Mutiny) runs $80k-$200k. Buy enterprise only after disciplined programme proves ROI.
Governance. Head of Growth or RevOps owns the CRO programme. Marketing, product, and sales contribute hypotheses; one programme manager prioritises and executes. Without a single owner, hypotheses pile up and tests don't ship. The CRO programme manager runs the weekly experiment review and the monthly hypothesis-log update.
Cadence. Quarterly experimentation cycle: 6-12 statistically significant tests per quarter (sized by traffic). Weekly experiment review: progress against significance, mid-flight issues, learning capture. Monthly hypothesis backlog: refresh from research, deprioritise stale items, identify follow-on tests. Annual CRO retrospective: review winning patterns, retire frameworks that didn't compound, reset programme metrics. Pair the cadence with the broader SaaS customer acquisition cost reduction discipline and the wider B2B demand generation strategy framework that ensures the right traffic is hitting the optimised pages.
Want a diagnostic on where your conversion funnel is leaking revenue?
Book a Growth Mapping CallThe 90-day rollout playbook
For a $10M-$40M ARR mid-market SaaS installing CRO discipline from a chaotic state, the 90-day sequence:
Days 1-30: Audit, instrument, research
Pull 90 days of funnel performance. Deploy Microsoft Clarity (free) for session replay and Hotjar Trial for heatmaps. Run 5-8 user interviews with recent customers and lost prospects. Build the conversion-by-stage table identifying the lowest-converting stage. Document 15-20 hypothesis candidates with evidence. Switch primary KPI from individual test wins to revenue-per-visitor lift. Target deliverable: documented audit + 15-20 hypotheses + signed-off prioritisation framework.
Days 31-60: Prioritise, design, ship first three tests
Score hypotheses on PIE/ICE. Pick the top 3 by score (one each on demo page, pricing page, hero/landing). Design variants. Calculate sample size for 95% confidence. Ship tests. Set up the hypothesis log as a living document. Train the team on statistical significance and "no peeking" discipline. Target: three live A/B tests, hypothesis log version 1.0.
Days 61-90: Analyse, deploy winners, plan Q2
Reach statistical significance on first three tests. Analyse lift by segment. Deploy winners; document losers and null findings. Plan Q2 experiments using research from initial tests. Build the quarterly experimentation cadence. Document the learning capture process. Target: 1-2 winning tests deployed, hypothesis log with 25-30 documented entries, Q2 backlog of 8-12 prioritised hypotheses, revenue-per-visitor lift visible in dashboard.
Architect a CRO programme that compounds revenue per visitor
peppereffect installs the seven-step CRO architecture for $10M-$40M ARR B2B SaaS leaders ready to stop guessing about conversion. We deploy the funnel-stage audit, the research engine, the hypothesis log, the statistical-significance discipline, and the AI-augmented testing layer that turns conversion optimisation from a quarterly project into a compounding revenue engine.
Book a Growth Mapping CallFrequently asked questions
What is B2B conversion rate optimization?
B2B CRO is the systematic practice of lifting conversion rates at every stage of the buyer funnel through hypothesis-driven testing — visitor-to-lead, lead-to-MQL, MQL-to-SQL, SQL-to-opportunity, opportunity-to-closed-won. The 2026 architecture combines seven repeatable steps (audit, research, hypothesise, prioritise, test, analyse, iterate), AI-driven personalisation, and quarterly experimentation cadence with a hypothesis log.
What's a good B2B SaaS conversion rate?
Median B2B SaaS visitor-to-lead conversion sits at 2.35%; top-quartile programmes hit 5-8%; top-decile sites convert at 10%+. Lead-to-MQL median is 37-41%, MQL-to-SQL median is 13-32%, opportunity-to-closed-won median is 20-30%. The 5x performance gap between median and top-decile is almost entirely engineering and CRO discipline.
How much can CRO improve B2B revenue?
Disciplined CRO programmes typically deliver 25-50% revenue-per-visitor lift in 12-18 months without buying a single new visitor. The compounding effect: a 0.5pp lift on each of four funnel stages produces 25-40% more closed-won ARR. CRO ROI typically lands at 3-5x versus paid acquisition spend at the same investment.
What are the highest-leverage B2B CRO levers?
Four levers consistently account for 70-80% of conversion lift: above-the-fold clarity (H1, hero CTA, social proof — 18-35% lift), form optimisation (fewer fields + progressive profiling — 30-60% lift), pricing page architecture (anchor + comparison + clear CTA — 22-45% lift), and trust signals (testimonials, case studies, security — 15-30% lift).
How do I run statistically significant A/B tests with low B2B traffic?
Use sample-size calculators (VWO, Optimizely) to establish minimum sample for 95% confidence. B2B traffic is lower than B2C, so most tests need 14-28 days. Don't peek mid-test; don't stop early. For pages below 1,000 monthly visitors, prioritise qualitative research (session replay, user interviews) over A/B testing — sample size won't reach significance.
What CRO tools do I need for mid-market B2B SaaS?
Minimal viable stack: GA4 + CRM (analytics), Microsoft Clarity (free session replay), Hotjar (heatmaps + surveys), VWO or Optimizely (A/B testing). Total annual cost: $8k-$25k. Buy enterprise tier (Mutiny, FullStory, Optimizely Web Experimentation) only after disciplined programme proves ROI. Tools matter least; testing discipline matters most.
How long does CRO take to show ROI?
First conversion lift on existing pages: 30-60 days from disciplined testing. Compounding revenue lift: 12-18 months as multiple stage-level wins compound. Top-quartile programmes show 25-50% revenue-per-visitor lift inside two quarters; bottom-quartile programmes never compound because they skip the architectural foundations and run isolated tests. buyer journey content map
Resources
- SaaSHero — 2026 B2B SaaS Conversion Benchmarks
- Powered by Search — B2B SaaS Funnel Benchmarks
- Prospeo — B2B Conversion Rates 2026
- Transmission Agency — B2B CRO Guide
- LaunchRocket — CRO for SaaS
- Infinity Marketing — CRO ROI
- VWO — A/B Test Sample Size
- OrbitForms — Progressive Profiling
- Veza Digital — SaaS Pricing Page Examples
- SaaS Funnel Lab — Demo Page Conversion Tips
- BlogPros — Trust Signal Examples
- Discovered Labs — Mobile CRO Playbook
- Kensium — AI Personalization for B2B Sales
- Stackmatix — Above-the-Fold Optimization
- Spike — Common CRO Mistakes in B2B Marketing


