

Data-driven decision making is the practice of grounding business choices in reliable, integrated data rather than intuition, and it depends far more on infrastructure than on willpower. Most founders already believe in it. The problem is that belief does not survive contact with fragmented systems, conflicting reports, and dashboards that answer the wrong questions. When the data is hard to find and harder to trust, even committed leaders quietly fall back on gut feel. The fix is not another dashboard. It is the underlying infrastructure - a single source of truth, clean data, and analytics wired into the decisions that actually move the business.
The performance gap is stark. Data-driven organisations are 23 times more likely to acquire customers, six times as likely to retain them, and 19 times more likely to be profitable than peers that run on instinct. Yet 58 percent of companies still base at least half their regular decisions on gut feel. That distance between what leaders know works and what they actually do is the opportunity this article addresses.
This guide covers what data-driven decision making actually requires, the performance case for building it, the structural reasons leaders stay stuck on intuition, what bad data really costs, the four layers of decision infrastructure, and where AI and agentic analytics fit. Here is what you will learn:
- Why data-driven decision making is an infrastructure problem, not a willpower problem
- The measurable performance gap between data-driven companies and their peers
- Why trust in data is falling even as pressure to use it rises
- The four layers of infrastructure that turn raw data into smart choices
- How AI and agentic analytics scale decision quality without scaling headcount
Key Takeaway
Dashboards do not make you data-driven. Infrastructure does. The companies that consistently make smart choices have built a single source of truth that feeds clean, current data into the exact decisions that drive revenue and margin. Everything else is decoration.
What Is Data-Driven Decision Making?
Data-driven decision making means your critical business decisions are supported by consistent metrics drawn from an integrated data platform, not by spreadsheet fragments, CRM exports, and anecdotal feedback. McKinsey frames the truly data-driven enterprise as one that integrates data into everyday workflows rather than relying on episodic analysis by an isolated data team. For a SaaS CEO, that means decisions about pricing, churn, and headcount draw on the same reliable numbers. For a professional services founder, it means staffing and client-profitability calls rest on unified data across time tracking, billing, and delivery.
The reframe that matters comes from MIT Sloan: start with the decision, not the data. Instead of asking what you can learn from the data you happen to have, identify the decisions that most affect performance and design your data collection backwards from those decisions. This is why so many analytics programmes disappoint - only 32 percent of companies report tangible, measurable value from their data investments. They bought tools without anchoring them to choices.

The infrastructure angle is unavoidable. A company running product data in one database, pipeline in a CRM, finance in an accounting tool, and support in a helpdesk has no single view of customer health or unit economics. Until that data is unified, "data-driven decisions" really means ad hoc analyses performed under time pressure. Building the connective tissue is a business systems architecture problem before it is an analytics one.
Do Data-Driven Companies Actually Perform Better?
The evidence that data-driven decision making pays off is consistent across every major research firm. Harvard Business Review's survey of 366 executives with Google Cloud found that self-identified data and AI leaders outperformed peers across the board: 81 percent reported strong operational efficiency versus 58 percent of others, 77 percent reported strong revenue performance against 61 percent, and 77 percent reported high customer loyalty compared with just 45 percent. The advantage is not confined to one metric - it compounds across the whole operating model.
| Business Metric | Data and AI Leaders | Other Companies |
| Strong operational efficiency | 81% | 58% |
| Strong revenue performance | 77% | 61% |
| High customer loyalty and retention | 77% | 45% |
| High employee satisfaction | 68% | 39% |
| Predictable IT costs | 59% | 44% |
Source: Harvard Business Review and Google Cloud, Big on Data (2021)
The financial case is just as strong. Boston Consulting Group's 2024 research found that AI leaders - companies with a real strategy and advanced capabilities - achieved 1.5 times higher revenue growth, 1.6 times greater total shareholder returns, and 1.4 times higher return on invested capital than non-leaders. Crucially, BCG found that 62 percent of AI's value sits in core functions like operations and sales, not peripheral back-office tasks. That is exactly where founders trying to decouple revenue from headcount should aim their investment.
Key Takeaway
The performance advantage is a flywheel: better data enables clearer visibility, which enables sharper investments, which generate richer data. But it is conditional - only 32 percent of companies realise measurable value from analytics. Tools alone do not create the advantage. The infrastructure that connects data to decisions does.
Why Do Leaders Still Trust Gut Feel?
Leaders fall back on intuition because trust in their own data is collapsing even as pressure to use it climbs. Salesforce's 2024 survey of more than 500 US business leaders found that confidence in data accuracy fell 27 percent and confidence in data relevance fell 18 percent in a single year. Fewer than half said their data strategy was aligned with business priorities, a figure down 14 points from 2023. When executives doubt the numbers reflect reality, intuition wins by default.

The pressure, meanwhile, is intense. In the same survey, 76 percent of leaders said they feel increasingly pressured to back their claims with data, 72 percent said their career trajectory depends on how data-driven they are, and 86 percent said it depends on how data-literate they are. Yet 63 percent have to find and interpret data themselves, and 54 percent are not fully confident in their ability to do so. That mismatch - high expectation, low capability and confidence - is precisely the gap where gut feel reasserts itself.
BARC's research puts numbers on the cultural divide: best-in-class companies base roughly 60 percent of decisions on information, while laggards base around 70 percent on gut feel. The difference is not intelligence or intent. It is whether the infrastructure makes the data-driven path easier than the intuitive one. When the right number is one glance away in a trusted dashboard, people use it. When it takes an afternoon of reconciliation, they guess.
Avoid This Mistake
Do not answer the wrong question precisely. MIT Sloan warns that most analytics programmes start from available data and produce dashboards full of metrics that never map to the decisions leaders actually face. Define the decision first, then build the data to inform it. A dashboard nobody uses to decide anything is cost, not capability.
What Does Bad Data Actually Cost?
Poor data quality is not a technical nuisance - it is a direct, quantifiable drain on the business. IBM's 2025 analysis found that more than a quarter of organisations lose over 5 million dollars a year to poor data quality, and 7 percent lose 25 million dollars or more. Those losses show up as mispriced contracts, flawed forecasts, duplicated work, and missed opportunities. IBM also found that 43 percent of COOs now rank data quality as their single most significant data priority, and that concerns about accuracy and bias are the leading barrier to scaling AI for 45 percent of leaders.
Then there is the data you are paying to store but never use. Veritas estimated that 54 percent of organisational data is dark - held with undetermined business value - while a further 33 percent is redundant, obsolete, or trivial, leaving only 15 percent identified as business critical. Old customer records, support transcripts, and log files sit unanalysed while they could be informing churn prediction and product roadmaps.
| Hidden Data Cost | Figure | Source |
| Firms losing $5M+/year to poor data quality | Over 25% | IBM 2025 |
| Organisational data that is dark (unused) | 54% | Veritas |
| Workday knowledge workers spend searching | ~30% | IDC |
| Companies realising measurable data value | 32% | MIT Sloan |
Sources: IBM, Veritas, IDC via Cottrill Research
The human cost compounds it. IDC data shows knowledge workers spend roughly 2.5 hours a day, about 30 percent of the workday, simply searching for information. When your operations and revenue teams lose a third of their time hunting across disconnected systems, they have little capacity left to analyse and act. Worse, when data feels hard to reach, people stop looking for it and revert to instinct - which is how fragmented infrastructure quietly manufactures a gut-feel culture.
What Are the Four Layers of Decision Infrastructure?
Turning raw data into smart choices requires four layers: a single source of truth, integration, analytics, and decision intelligence. Each depends on the one below it. Skip the foundation and the AI layer on top simply automates the propagation of errors. This is the model peppereffect installs when it builds a decision-making operating system for B2B founders.
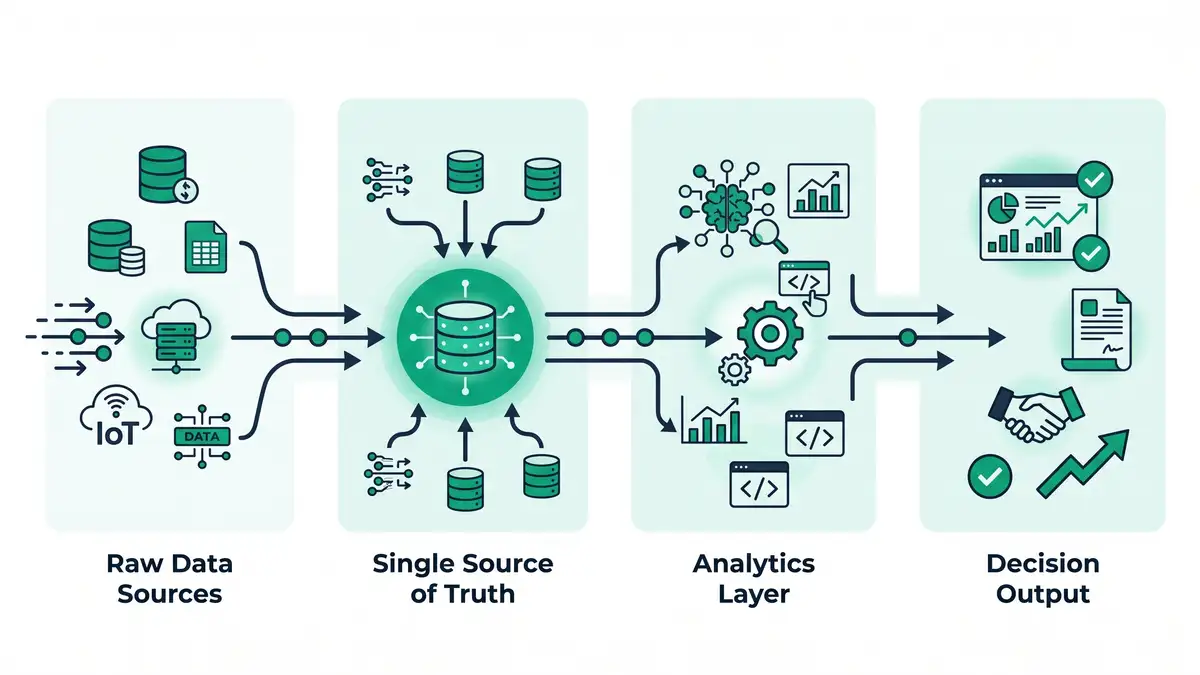
Single Source of Truth
An integrated, governed data model that reconciles customers, revenue, and products across every system. Without it, reports contradict each other and confidence erodes. This is the layer that ends the reconciliation wars between departments.
Integration and Pipelines
Automated pipelines that pull data from your CRM, product, billing, and support tools into that unified model continuously, through workflow orchestration rather than manual exports. Fresh data is decision-grade data.
Analytics and Self-Service BI
Governed dashboards and self-service tools that let revenue and operations teams explore data without a data scientist in the loop. Leading BI platforms increasingly bundle modelling and natural-language querying to lower the literacy barrier.
Decision Intelligence and AI Agents
AI and agentic workflows that monitor the data continuously, surface anomalies, and recommend or execute actions inside your existing tools, with humans at the governance gates. This is where infrastructure becomes leverage.
How Do You Build Decision Infrastructure?
Build it decision-first, foundation-up. The sequence below mirrors the way peppereffect architects a decision-making system, and it echoes the discipline of fixing structure before adding load found in the Scaling Up methodology.

Map your critical decisions. Name the handful of choices that most affect performance - churn prevention, pricing, staffing, segment focus - and specify what data each one needs. Build the single source of truth. Consolidate the required data into one governed model so every team decides from the same definitions. Automate the pipelines. Replace manual exports with continuous integration so the data is always current, which is where a sound business systems architecture earns its keep.
Curate for quality, not volume. Given that most data is dark or redundant, focus effort on the high-value datasets that inform real decisions and archive the rest. Deploy AI at the decision points. Layer CRM automation and agentic analytics onto the clean foundation so the system proposes actions - flag at-risk accounts, surface upsell signals - while people keep judgement over the consequential calls.
Not sure which decisions your data should be driving first? A data audit maps your critical choices and the infrastructure gaps blocking them.
Book Your Data Audit
Where Do AI and Agentic Analytics Fit?
AI is the amplifier, not the foundation. On top of clean, unified data it multiplies decision quality and speed; on top of fragmented data it multiplies mistakes. BCG found that 74 percent of companies struggle to show tangible value from AI, and only 26 percent have moved beyond proofs of concept - almost always because of the data quality, integration, and governance gaps below the AI layer.
The leaders who win are explicit about it. In the HBR study, 57 percent of data and AI leaders had an enterprise strategy for using AI to augment decision making, versus just 17 percent of everyone else. Applied well, agentic analytics continuously watches the single source of truth, generates the daily pipeline summary, flags the project heading for a budget overrun, and recommends the renewal offer - work that used to require analysts. That is how a lean team oversees more decisions without adding headcount, the core of the Freedom Machine. But the prerequisite never changes: fix the data first, because 45 percent of leaders already cite accuracy and bias as the reason they cannot scale AI safely.
Frequently Asked Questions
What is data-driven decision making in simple terms?
Data-driven decision making means basing your business choices on reliable, integrated data instead of intuition or anecdote. In practice it means the decisions that matter most - pricing, hiring, churn prevention, segment focus - are informed by consistent metrics drawn from a unified data source rather than scattered spreadsheets and CRM exports. The key is that it is an infrastructure discipline: you need a single source of truth feeding clean data into specific decisions, not just more dashboards. Companies that do this well are 23 times more likely to acquire customers and 19 times more likely to be profitable than peers running on gut feel.
Why do most data initiatives fail to deliver value?
Because they start with the data instead of the decision. MIT Sloan found only 32 percent of companies realise measurable value from their data investments, largely because they build dashboards around available data rather than around the choices leaders actually face. The result is sophisticated reporting that never maps to real questions like whether a segment is profitable. The fix is decision-first design: name the critical decisions, then build the data model, pipelines, and analytics backwards from them. Pairing that with a sound business systems architecture is what turns tools into outcomes.
How much does poor data quality really cost?
More than most leaders realise. IBM's 2025 research found over a quarter of organisations lose more than 5 million dollars a year to poor data quality, and 7 percent lose 25 million or more, through mispriced contracts, flawed forecasts, and duplicated work. On top of that, roughly 54 percent of organisational data is dark - stored but never used - and knowledge workers spend around 30 percent of their day just searching for information. Curating high-value data and consolidating it into a single source of truth directly attacks all three costs.
What is the difference between business intelligence and decision intelligence?
Business intelligence describes what happened through dashboards and reports; decision intelligence goes further by recommending or automating what to do next. BI shows you churn rose last quarter; decision intelligence, often powered by agentic workflows, flags the specific at-risk accounts and proposes the retention action. Decision intelligence sits at the top of the infrastructure stack and only works when the data, integration, and analytics layers beneath it are sound. It is the layer that turns data-driven insight into data-driven action.
How does data-driven decision making help decouple growth from headcount?
When AI agents handle data wrangling, monitoring, and first-line analysis, each manager can oversee more processes and decisions without a proportional increase in analysts. BCG found that 62 percent of AI's value lies in core functions like operations and sales, exactly where throughput matters. Instead of hiring an analyst for every new reporting need, the infrastructure absorbs it. This is the mechanism behind decoupling revenue from headcount - the system scales decision capacity, not the payroll.
Do we need a big data team to become data-driven?
No. What you need is well-designed infrastructure and a clear set of decisions to support. Modern BI platforms with self-service and natural-language querying let non-specialists explore data, and AI workflow automation can handle the data preparation and analysis that used to require a data scientist. Start with a small set of curated dashboards tied to your most important decisions, build the single source of truth beneath them, and expand from there. The goal is capability embedded in systems, not a large intermediate layer of manual analysis.
Build the Infrastructure for Smart Choices
peppereffect designs and installs the decision-making operating system your B2B business needs to move from gut feel to smart choices. We start with a data audit that maps your critical decisions, then architect the single source of truth, pipelines, and agentic analytics that scale decision quality without scaling headcount.
Book Your Data AuditSee how the four-layer architecture works → enterprise value and sellability
Resources
- Harvard Business Review and Google Cloud - Big on Data: Why Data-Driven Companies Are More Profitable
- Boston Consulting Group - AI Adoption in 2024
- IBM Institute for Business Value - The True Cost of Poor Data Quality
- Salesforce - Survey: Leaders' Trust in Business Data
- BARC - Gut Feel vs. Data-Driven Decision-Making
- MIT Sloan Management Review - Decisions, Not Data, Should Drive Analytics Programs
- McKinsey - The Data-Driven Enterprise of 2025
- Keboola - 5 Stats on How Data-Driven Organizations Outperform
- Veritas - Dark Data Assessment (Global Databerg Report)
- Qlik - 2026 Gartner Magic Quadrant for Analytics and BI Platforms