

What is business process mapping?
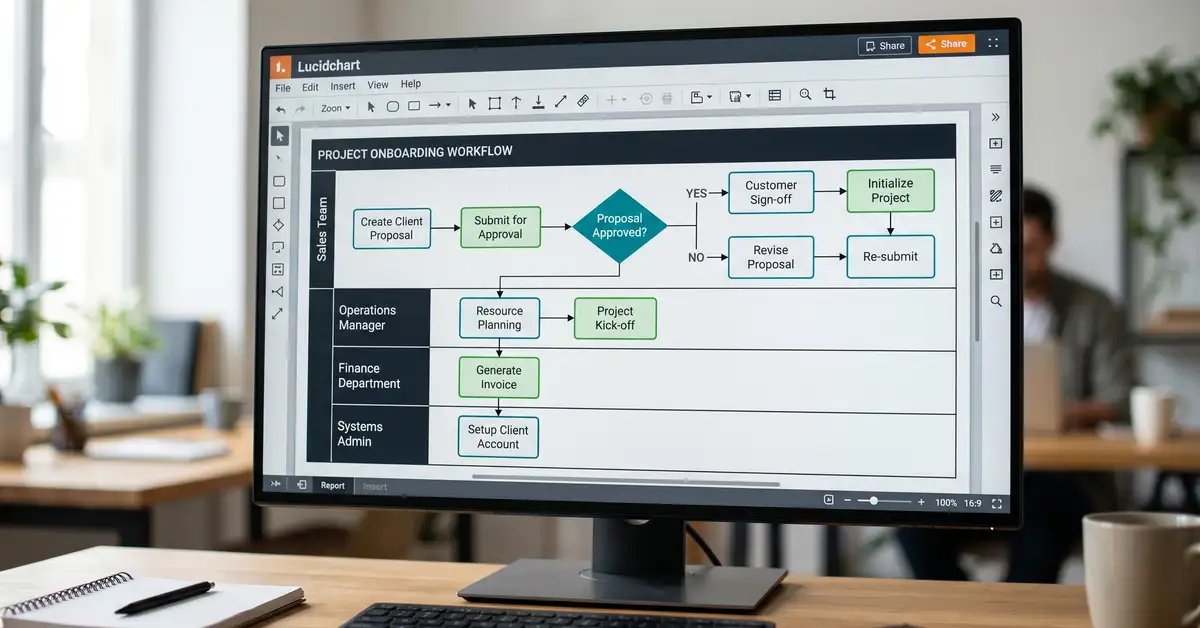
Business process mapping is the practice of drawing a process as a visual diagram, showing every step, decision, person, and handoff, so you can see how work actually flows and where it breaks. Lucidchart defines a process map as a planning and management tool that visually describes the flow of work and the series of events that produce an end result (Lucidchart, 2026). In plain terms, it turns "how we do this" out of people's heads and into a picture the whole team can see, question, and improve.
It is worth separating three terms people use interchangeably. Process mapping is the umbrella activity of diagramming a process. Business process modelling is the more formal, technical version, usually written in a standard notation called BPMN. Value stream mapping is a lean technique that adds time and waste analysis. For most teams, a clear process map is the practical starting point, and the prerequisite for any serious attempt to improve or automate a process. If automation is where you are heading, our guide to business process automation services picks up where mapping ends.
What you'll learn in this guide:
- What business process mapping is and why it matters
- The main types and levels of process map
- The standard symbols and what each one means
- How to create a process map, step by step
- Best practices, tools, and the link to automation
Key Takeaway
A process map is not bureaucracy, it is x-ray vision. You cannot fix or automate a process you cannot see, and most teams discover their biggest bottlenecks only once the steps are drawn out in front of them.

Why business process mapping matters
Mapping pays for itself by making invisible problems visible. When a process lives only in people's heads, its bottlenecks, redundant steps, and broken handoffs stay hidden, and everyone assumes someone else owns the messy part. Drawing it out exposes all of it: the approval that takes three days, the data re-entered into two systems, the step nobody is sure who performs. Process mapping identifies these bottlenecks and inefficiencies and creates a shared understanding of how work really flows (APQC, 2024).
Beyond fixing today's mess, a map is the foundation for several things at once: faster onboarding because new hires can see the process, compliance and quality standards like ISO 9001 that require documented processes, and continuous improvement because you cannot measure change without a baseline. Most importantly for a growing business, it is the prerequisite for automation. You cannot automate what you have not mapped, and our breakdown of moving from task automation to orchestration shows why that sequence matters.
Key Takeaway
The return on mapping is not the diagram, it is the decisions it enables: what to fix, what to standardise, and what to automate. The map is cheap. The clarity is the asset.
The main types of process map
Different jobs need different maps, and choosing the right level of detail is half the skill. There are four you will use most often.

A high-level map, often built as a SIPOC (Supplier, Inputs, Process, Outputs, Customer), gives the big picture in a handful of boxes and can be drawn in under an hour. A detailed flowchart captures every step and decision, the working document for analysis and improvement. A swimlane or cross-functional map adds horizontal lanes for each role or department, making it instantly clear who owns each step and where work passes between teams, which is where most delays hide. And a value stream map is the lean version, layering in time and distinguishing value-adding steps from waste. Teams often start high-level to agree scope, then zoom into a detailed or swimlane map for the parts that matter.
Standard process mapping symbols
A small set of shapes does almost all the work, and they are a near-universal language. Learn these five and you can read or draw most process maps.
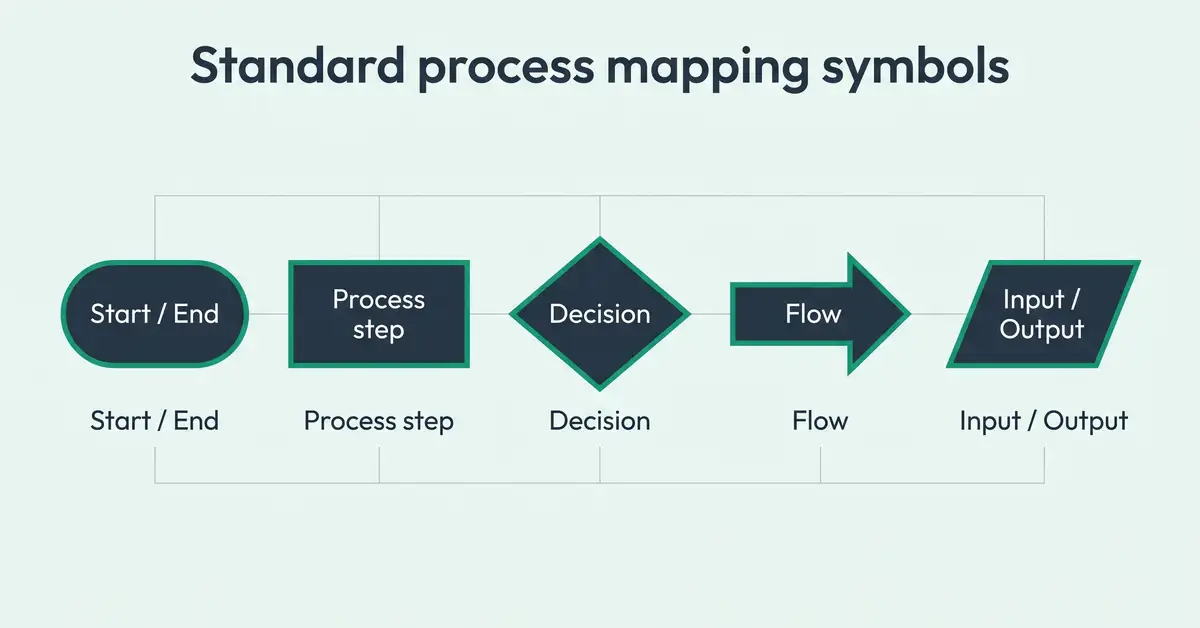
| Symbol | Shape | Means |
| Terminator | Oval | The start or end of the process |
| Process step | Rectangle | An action or task |
| Decision | Diamond | A yes or no branch point |
| Flow | Arrow | The direction and sequence of steps |
| Input / output | Parallelogram | Data going in or coming out |
Sources: Lucidchart, Gliffy, Flowchart (Wikipedia).
When you need a rigorous, formal notation, for example to hand a process to engineers or an automation platform, the standard is BPMN, Business Process Model and Notation, maintained by the Object Management Group and recognised as the global standard for modelling business processes (OMG, 2026). For most internal mapping, the five symbols above are enough. Reach for BPMN when precision and shareability across tools matter.
How to create a business process map, step by step
A good map comes from a repeatable method, not artistic talent. Follow these six steps and you will produce a map your whole team trusts.
Define the process and its boundaries
Name the process and agree exactly where it starts and stops. A fuzzy scope produces a useless map. Pick one process, not three.
Gather the people who do the work
Map with the people who actually perform the process, not just their managers. They know the workarounds and the real sequence.
List and sequence the steps
Brainstorm every activity, then put them in order. Capture what actually happens today, not the idealised version.
Draw it with standard symbols
Lay the steps out with the symbols above, adding decision diamonds and handoffs. Use swimlanes if more than one role is involved.
Validate with the team
Walk the map past the people who do the work and fix what is wrong. A map nobody has checked is a guess, not a record.
Find the improvement opportunities
Now mark the bottlenecks, redundant steps, and manual handoffs. This is where the map turns into action, and into an automation shortlist.
Mapped your process and found the bottlenecks? See what to automate next.
Compare workflow automation toolsBest practices and common mistakes
The difference between a useful map and wasted effort comes down to a few habits. Map the current state honestly before you design the ideal future state, because you cannot improve a process you have romanticised. Involve the people who do the work, since the map is only as accurate as its sources. Match the level of detail to the purpose, a board does not need every keystroke, an automation team does. Never skip validation, the step most often cut under time pressure and the one that makes the map trustworthy. And treat the map as a living document, not a one-off, because a process map that is never updated quietly becomes fiction.
Watch Out
The most expensive mapping mistake is automating a broken process. A map makes a bad workflow look official, and it is tempting to wire it straight into software. Do not. Use the map to fix the process first, remove the redundant steps and unclear handoffs, and only then automate the clean version. Automating a mess just makes the mess run faster.
Tools for business process mapping
You do not need expensive software to start. A whiteboard and sticky notes are a perfectly good first draft, and often the best way to map with a group. When you move to digital, the common tools are Lucidchart, Microsoft Visio, and Miro for collaborative mapping, with draw.io (diagrams.net) as a capable free option. Dedicated business process management platforms add modelling, simulation, and governance for larger organisations. Start with whatever lets the team see and edit the map together, then graduate to a more structured tool if you need version control, BPMN, or a handoff to automation.
A practical note on choosing: do not let tool selection delay the mapping itself. The value is in the conversation and the validated diagram, not the software. Teams routinely lose a week debating platforms when a marker and a wall would have surfaced the bottleneck in an afternoon. Pick the simplest tool that lets everyone contribute, capture the current state, and move on to fixing it. When the map is ready to become a real automated workflow, a platform like n8n can turn the cleaned process into a running system.

From map to machine: process mapping and automation
Business process mapping is the single most valuable thing you can do before automating. A clean map is a specification: it shows exactly which steps are manual, repetitive, and rules-based, the prime candidates for automation, and which involve judgement that should stay human. It also exposes the steps you should delete or fix before any software touches them. Skip the map and you risk the classic failure of automating a broken process at scale, locking in the very inefficiencies you meant to remove.

This is where mapping connects to the wider system. Once a process is mapped and cleaned, it becomes a workflow you can build in a tool, or an agent you can deploy. Our guides to workflow orchestration and no-code AI agents cover the build step that follows a good map. The sequence is always the same: map, fix, then automate.
A map shows the work. A system does it.
Mapping reveals what to fix and what to automate. peppereffect turns that map into autonomous, logic-gated systems that run the process for you, on n8n and beyond, so your revenue decouples from headcount. We map, we fix, we automate, and we hand you the machine.
Book a Growth Mapping CallFrequently asked questions about business process mapping
What is business process mapping? Business process mapping is the practice of drawing a business process as a visual diagram that shows every step, decision, person, and handoff. It turns an undocumented process into a picture the whole team can see and improve. It is used to understand how work flows, find bottlenecks and redundancies, document processes for compliance, and prepare a process for automation.
What are the standard process mapping symbols? The five core symbols are an oval for the start or end of the process, a rectangle for a process step or action, a diamond for a decision or yes-or-no branch, an arrow for the direction and sequence of flow, and a parallelogram for an input or output such as data. These flowchart symbols are near-universal. For formal, technical modelling, the BPMN standard adds a richer set.
What are the main types of process map? The four most common are the high-level map, often a SIPOC that gives the big picture quickly, the detailed flowchart that captures every step and decision, the swimlane or cross-functional map that adds lanes showing who does each step, and the value stream map, a lean technique that layers in time and distinguishes value from waste. Most teams start high-level, then zoom in where it matters.
How do you create a business process map? Define the process and its start and stop boundaries, gather the people who actually do the work, list and sequence every step, draw it using standard symbols with decision points and handoffs, validate the map with the team, and then mark the bottlenecks and improvement opportunities. The key discipline is mapping the process as it really is today before designing an improved version.
What is the difference between process mapping and BPMN? Process mapping is the general activity of diagramming a process with simple flowchart symbols, suitable for any team. BPMN, or Business Process Model and Notation, is a formal standard maintained by the Object Management Group that uses a richer, precise notation for modelling business processes, often when handing a process to engineers or automation software. Use simple mapping for clarity, BPMN when you need rigour and tool portability.
Why map a process before automating it? Because you cannot automate what you have not mapped, and automating a broken process just makes the mess run faster. A map shows exactly which steps are manual and rules-based, the right candidates for automation, and which are broken and should be fixed first. Mapping, cleaning, then automating is the sequence that produces reliable results rather than locked-in inefficiency. operational efficiency digital transformation strategy technology adoption workflow audit standard operating procedures process documentation
Resources
- Lucidchart Process Mapping Guide: definition, symbols, and templates.
- BPMN (Object Management Group): the formal business process modelling standard.
- IBM: What is BPMN?: when and why to use the formal notation.
- Asana Process Mapping: steps, types, and examples.
- APQC: What is Process Mapping?: purpose and benefits.


