

Demand generation and lead generation are not synonyms. They are two distinct architectures, with two different success metrics, two different operating teams, and two different time horizons. The mid-market B2B SaaS companies that conflate them ship a marketing org that produces neither: weak brand presence creating no future demand, and a lead-capture engine that converts the same shrinking pool of in-market buyers as their competitors. Only 5% of B2B buyers are in-market at any moment per the Ehrenberg-Bass Institute's 95-5 rule. Lead gen captures from that 5%. Demand gen exists to win the other 95% before they enter the market.
This article installs the disambiguation: precise definitions, the 2024-2026 funnel benchmarks for each, the architectural division of labour, the five common failure modes that compound silently, the agentic AI shift collapsing parts of the distinction in 2026, and the 90-day reorganization roadmap. Built for CEOs whose marketing budget is asking for "demand gen" without a clear definition — and whose sales org is asking why pipeline conversion has stalled.
The Definitional Difference: Build Demand vs Capture Demand

Demand generation is the architecture that creates and sustains the awareness, education, and category positioning that makes future buyers eventually consider you. It runs on a 6-24 month time horizon. Its outputs are not leads — they are mental availability, brand recall, share of voice, and the long-term pipeline of accounts that will eventually enter the in-market state. The work is podcasts, video, organic social, ungated content, executive thought leadership, owned audience, and category-defining events. Success is measured in branded search volume, share of voice, content-cited revenue, and pipeline velocity 6-12 months later.
Lead generation is the architecture that captures buyers who have already entered the in-market state and converts them to qualified pipeline. It runs on a 0-90 day time horizon. Its outputs are MQLs, SQLs, sales-accepted opportunities, and closed-won revenue this quarter. The work is paid search on bottom-funnel keywords, gated whitepapers and webinars, retargeting, intent-data outbound, and outbound SDR sequences targeting accounts showing buying signals. Success is measured in cost-per-lead, MQL-to-SQL conversion, sales-accepted opportunity rate, and pipeline created this month.
Both are necessary. Neither substitutes for the other. The Ehrenberg-Bass Institute's 95-5 research, validated repeatedly across B2B categories, makes the architectural decision for you: only 5% of buyers are in-market at any given moment, with the remaining 95% out-of-market and accessible only through brand and demand creation work (Marketing Science / Ehrenberg-Bass). A marketing org that puts 100% of its budget on lead capture has chosen to compete with every competitor for the same 5% of the market — and ignored the funnel that fills the in-market state in the first place. The result is a CAC trajectory that inflates faster than ARR — see the CAC reduction architecture for the operational fix.
The 95-5 Rule
If you are spending 90% on lead gen and 10% on demand gen, you are not just under-investing in brand. You are systematically forfeiting the 95% of your future buyers who are not yet ready to fill out a form. By the time they enter the in-market state, your competitor's name is in their head — not yours.
The Dual-Funnel Architecture
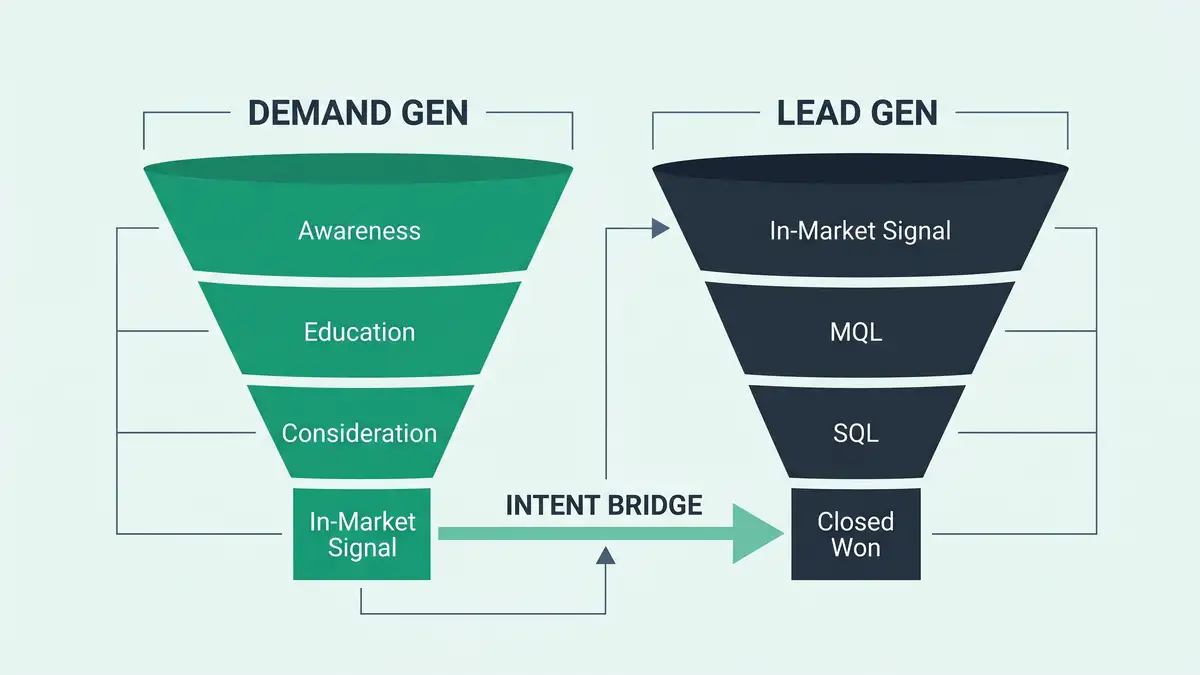
The architectural mistake most mid-market SaaS companies make is treating the funnel as one linear pipeline. The board-grade architecture is two parallel funnels connected by an intent bridge. The demand-gen funnel feeds buyers from out-of-market through awareness and education to the in-market signal. The lead-gen funnel starts at the in-market signal and converts through MQL, SQL, and closed-won.
| Layer | Demand Gen Activity | Lead Gen Activity |
| Awareness | Podcast, video, organic social, executive thought leadership | — |
| Education | Long-form content (ungated), event keynotes, peer community | — |
| Consideration | Comparison content, category positioning, customer stories | Intent-data outbound |
| In-Market Signal | Buyer enters search/research mode | Branded search, intent triggers |
| MQL → SQL | — | Form fills, demo requests, content downloads, retargeting |
| Closed-Won | — | SDR / AE qualification, sales cycle, contract |
Sources: HubSpot — Demand Gen vs Lead Gen, Similarweb — B2B Dark Funnel 2026, Forrester — Digital Natives Rewriting B2B Buying.
The intent bridge — the layer where demand gen hands off to lead gen — is where most companies leak. Autobound's 2026 intent-data provider comparison documents the role of Bombora, 6sense, and Demandbase as the infrastructure that detects when an out-of-market buyer enters the in-market state — without waiting for them to fill out a form. Companies running an intent-data layer convert at materially higher rates than form-only lead capture.
2024-2026 Funnel Conversion Benchmarks

| Stage | 2026 B2B SaaS Median | Top Quartile |
| Visitor → MQL | 1.5-3% | 5%+ |
| MQL → SQL | 13% | 25%+ |
| SQL → Opportunity | 30-45% | 55%+ |
| Opportunity → Closed-Won (Inbound) | 22-28% | 35%+ |
| Opportunity → Closed-Won (Outbound) | 15-22% | 28%+ |
| Sales Cycle Length (mid-market) | 60-90 days | 30-45 days |
Sources: Understory Agency — MQL-to-SQL Benchmarks 2026, Kondo — B2B Sales Benchmarks 2025, Digital Applied — Conversion Rate Benchmarks 2026, Martal — MQL vs SQL B2B Guide 2026.
The number that matters most for the demand-vs-lead disambiguation is the visitor-to-MQL rate of 1.5-3% mid-market. The other 97-98.5% of visitors are not in-market today — and the only mechanism to convert them later is sustained demand-gen presence in their feed, peer Slack groups, podcasts, and search results. Lead gen alone converts the 1.5-3% who are ready now. Demand gen creates the next quarter's 1.5-3%. The structural sister metrics that bridge both — Net Revenue Retention and expansion revenue — are how mid-market SaaS compounds beyond the new-logo treadmill.
The Brand-Activation 60/40 Rule for B2B SaaS
Les Binet and Peter Field's research, codified in the LinkedIn B2B Institute's B2B Effectiveness Code, established the optimal brand-vs-activation budget split: 60% on long-term brand-building (demand gen), 40% on short-term sales activation (lead gen). The B2B-specific version of the rule, validated across hundreds of campaigns, has been the consensus among effectiveness researchers for the past decade. Companies running closer to 80/20 lead-gen-heavy underperform the 60/40 cohort on long-term revenue growth and CAC efficiency.
The mid-market B2B SaaS reality in 2026 is most companies running 80-90% lead gen / 10-20% demand gen — exactly inverse to the empirical optimum. The reason is short-term measurability: lead gen produces an MQL count that the CMO can show the board next month, while demand gen produces compounding effects 6-12 months out. The board demands attribution; lead gen attributes cleanly; demand gen does not. DigitalScouts' multi-touch attribution guide documents the structural problem: the touches that built demand are credit-stripped by last-click attribution that gives the lead-gen channel all the value.
Diagnose whether your marketing org is structurally trapped in the 80/20 lead-gen mode and missing the 60/40 demand-gen lift.
Book a Growth Mapping CallThe B2B Buyer Journey: 11+ Touches Before In-Market

Forrester's B2B buyer-journey research consistently shows mid-market B2B buyers absorbing 11+ touches before they enter an active buying cycle, with an average of 6-10 stakeholders involved by the time the in-market signal fires. Corporate Visions' 2026 B2B buying behaviour analysis documents the shift to "self-serve" research: 70%+ of the buying journey is completed before sales contact, and 60%+ of the touches happen in dark social — Slack groups, peer communities, podcasts, and unattributed video — that lead-gen attribution simply cannot see.
This is the structural reason demand gen cannot be replaced by more lead gen. The 11+ touches that build the in-market signal happen in channels that a pure lead-gen org neither produces content for nor measures. By the time the buyer fills out a form, the brand decision has already been made — and your demand-gen presence over the previous 12 months determined whether your name was on the shortlist or not. Your B2B content strategy is the operating layer where this presence is built or forfeited.
Five Failure Modes That Compound Silently
Failure 1 — Treating MQLs as the Conversion Metric
If marketing's primary KPI is MQLs, marketing will optimize for form fills regardless of fit. The result: high MQL volume, plummeting MQL-to-SQL conversion, and sales rejecting marketing's leads. The shift codified by 2X Marketing's MQL-vs-ABX analysis is to qualified-account or sales-accepted-opportunity as the marketing KPI — not raw MQL count.
Failure 2 — No Brand Investment
Companies running 90% lead gen / 10% demand gen are systematically forfeiting the 95% of their future buyers. The compounding cost is invisible quarterly but devastating annually: brand recall stagnates, branded search declines, and competitor share-of-voice grows in the same content niches you should own.
Failure 3 — Demand-Gen Content Gated Like Lead-Gen Content
Gating thought-leadership content behind a form converts the small percentage already-in-market and silences the 95% who would have shared, cited, and amplified the work. Demand-gen content must be ungated. Lead-gen content (whitepapers tied to specific in-market triggers, calculators, comparison guides) earns a gate. Mixing the two destroys both.
Failure 4 — Demand-Gen Team Measured on Lead Targets
If the demand-gen team's quarterly review is "how many leads did your podcast generate?" the team will either kill the podcast or warp it into a lead-capture vehicle. The correct demand-gen metrics are share-of-voice, branded search volume, dark-social mentions, and pipeline-velocity 6-12 months out. FullFunnel documents the measurement architecture.
Failure 5 — No Integration Between Teams
Demand gen and lead gen as siloed teams produce uncoordinated motions: demand-gen content does not link to lead-gen offers, lead-gen retargeting does not align with demand-gen content themes, and intent signals captured by lead gen do not feed back to inform demand-gen targeting. The integration layer is a shared CRM-plus-intent-data spine — see your CRM automation architecture.
Agentic AI: Collapsing Parts of the Distinction in 2026

The 2025-2026 inflection point is agentic AI compressing the bridge between demand gen and lead gen. AI-driven personalization at scale (Clay, Apollo.io, 11x.ai, Default) generates demand-gen content variants and outbound sequences calibrated to specific account intent signals. Agentic SDR agents detect in-market signal the moment it fires and trigger personalized outreach within hours rather than weeks. Multi-touch attribution platforms now use ML to credit the actual demand-creating touches rather than rewarding the last click.
The structural shift is that the demand-vs-lead distinction remains real for budget allocation and team structure — but the operational handoff is becoming agentic, real-time, and signal-driven. Companies that install agentic workflow orchestration across the demand-to-lead bridge see 30-50% conversion lift on the in-market signal-to-MQL handoff, and 25-40% reduction in time-to-MQL once a signal fires. The execution layer is your sales automation architecture, with agentic SDR sequences firing on the intent signal. The two funnels stay separate strategically, but their integration becomes near-real-time operationally.
The 90-Day Marketing Reorganization Roadmap
Days 1-30: Diagnose the Current Mix
Audit current marketing budget split: % on demand gen vs % on lead gen. Audit team structure: who owns brand, who owns capture. Audit content inventory: ungated thought leadership vs gated lead magnets. Baseline branded search, share of voice, MQL volume, MQL-to-SQL conversion, and pipeline-by-source.
Days 31-60: Restructure Team & Budget
Split demand-gen and lead-gen teams with separate KPIs. Reallocate budget toward 60/40 brand/activation (or at minimum 40/60 — recovery from 80/20 takes 2-3 quarters). Assign demand-gen team to share-of-voice, branded search, dark-social mentions, and pipeline-velocity-12-months-out. Assign lead-gen team to MQL-to-SQL conversion, sales-accepted-opportunity rate, and pipeline-this-quarter.
Days 61-90: Install the Intent Bridge
Deploy intent-data infrastructure (Bombora, 6sense, or Demandbase) as the bridge layer between demand and lead. Wire demand-gen content engagement signals into the CRM as account-level intent indicators. Trigger agentic SDR outreach the moment intent fires. Run weekly bridge-conversion reviews to optimize the demand-to-lead handoff.
Bottom Line
Demand generation and lead generation are two distinct architectures with two different success metrics, two different time horizons, and two different operating teams. The 95-5 rule makes the strategic case: lead gen captures from the 5% of in-market buyers; demand gen creates the future 5%. The 60/40 brand-activation rule makes the budget case. The 11+ touches before in-market makes the journey case. The five failure modes (MQL-as-KPI, no brand investment, gated demand content, lead-target demand teams, no integration) compound silently until pipeline conversion stalls and CAC inflates. Agentic AI in 2026 is compressing the operational handoff between the two funnels, but the strategic distinction is real and unchanging. The CEO's job is not to fund demand gen and lead gen as one budget line. It is to install both architectures in parallel, with separate KPIs, and engineer the intent bridge between them.
Install the Dual-Funnel Architecture
peppereffect runs the 90-day marketing reorganization for $10M-$40M ARR B2B SaaS — current-state diagnostic, team and budget restructure to 60/40 brand-activation, intent bridge deployment with agentic SDR orchestration. Architectural, not advisory. Outcome target: 30-50% lift on in-market-to-MQL conversion, 6-12 month pipeline-velocity compounding from demand gen, CAC compression as brand investment matures.
Book Your Growth Mapping CallSee the B2B Lead Generation architecture →
Frequently Asked Questions
What is demand generation?
Demand generation is the marketing architecture that creates and sustains awareness, education, and category positioning so that future buyers eventually consider you when they enter the in-market state. It runs on a 6-24 month time horizon. Outputs include branded search volume, share of voice, content-cited revenue, and pipeline velocity 6-12 months out. The work is podcasts, video, organic social, ungated long-form content, executive thought leadership, owned audience, and category-defining events.
What is lead generation?
Lead generation is the marketing architecture that captures buyers who have already entered the in-market state and converts them into qualified pipeline. It runs on a 0-90 day time horizon. Outputs are MQLs, SQLs, sales-accepted opportunities, and closed-won revenue this quarter. The work is paid search on bottom-funnel keywords, gated whitepapers and webinars, retargeting, intent-data outbound, and SDR sequences targeting accounts showing buying signals.
What's the difference between demand generation and lead generation?
Demand gen creates the future demand — building mental availability with the 95% of buyers who are not yet in-market. Lead gen captures and converts the 5% who are in-market today. Demand gen runs on a 6-24 month time horizon and is measured in share of voice, branded search, and pipeline velocity. Lead gen runs on a 0-90 day horizon and is measured in MQLs, SQLs, and pipeline-this-quarter. Both are necessary; neither substitutes for the other.
What is the 95-5 rule in B2B marketing?
Coined by the Ehrenberg-Bass Institute and validated across B2B categories, the 95-5 rule states that only 5% of B2B buyers are in-market for any given product at any moment, with the remaining 95% out-of-market. Demand gen exists to win the 95% before they enter the in-market state. Lead gen captures the 5% who are ready now. A marketing org spending 90% on lead gen has chosen to compete with every competitor for 5% of the market.
What is a good MQL-to-SQL conversion rate for B2B SaaS?
The 2026 B2B SaaS median is 13% MQL-to-SQL. Top-quartile companies hit 25%+. Below 10% indicates lead-quality issues — likely caused by treating MQLs as a marketing KPI and over-optimizing for form fills regardless of fit. The fix is shifting marketing's primary KPI from raw MQL count to qualified accounts or sales-accepted opportunities.
How should I split my marketing budget between demand gen and lead gen?
The Binet and Field B2B benchmark, codified in the LinkedIn B2B Institute's B2B Effectiveness Code, is 60% brand-building (demand gen) and 40% sales activation (lead gen). Most mid-market B2B SaaS companies run closer to 80-90% lead gen, which empirically underperforms the 60/40 cohort on long-term revenue growth and CAC efficiency. Recovery from 80/20 to 60/40 typically takes 2-3 quarters of disciplined reallocation.
What is intent data and how does it bridge demand gen and lead gen?
Intent data (from providers like Bombora, 6sense, Demandbase) detects when an account or buyer enters the in-market state — typically by tracking behavioural signals like research activity, content consumption, and topic engagement. It is the operational bridge between demand gen (creating eventual demand) and lead gen (capturing it): the moment the in-market signal fires, intent data triggers personalized outreach within hours rather than waiting for a form fill. B2B demand generation strategy account-based marketing implementation
Resources
- Ehrenberg-Bass / Marketing Science — 95-5 Rule
- HubSpot — Demand Gen vs Lead Gen
- Understory Agency — MQL-to-SQL Conversion Benchmarks
- Kondo — B2B Sales Benchmarks 2025
- Digital Applied — Conversion Rate Benchmarks 2026
- Martal — MQL vs SQL B2B Guide 2026
- Forrester — Digital Natives Rewriting B2B Buying
- Similarweb — B2B Dark Funnel 2026
- Autobound — Intent Data Providers 2026
- Corporate Visions — B2B Buying Behaviour 2026
- DigitalScouts — Multi-Touch Attribution in B2B
- 2X Marketing — MQL vs ABX
- FullFunnel — Playbooks for Long Sales Cycles
- The B2B Playbook — Demand Generation Strategy 2026
- Gumloop — AI Lead Generation Tools 2026
- Demand Gen Report — B2BMX 2026 GTM Tracks


