The Technology ROI Framework, Explained
A technology ROI framework is a structured method for deciding whether a software, SaaS, or automation purchase will return more value than it costs, measured across its full lifecycle rather than its sticker price. At its core sits a simple formula: ROI equals total benefits minus total costs, divided by total costs. The discipline is in the inputs. Most B2B leaders approve tools on a per-seat price and a vendor demo, then discover the real cost in implementation, integration, training, and licenses nobody uses. A proper framework forces total cost of ownership, adoption likelihood, and payback into the decision before the money is committed.
The stakes are high because spend is high and waste is endemic. The enterprise software market reached roughly $257 billion in 2025 and is projected to hit $811 billion by 2035, the average company now runs 106 SaaS applications, and Zylo finds that about 53% of SaaS licenses sit unused or underused. Buying technology is easy. Generating a return from it is not.
This framework gives you the formula, the 2026 benchmarks, the hidden costs that destroy returns, and a weighted scorecard to evaluate any tool. It is the same evaluation discipline behind our build vs buy software and automate vs hire decision frameworks.
What you'll learn in this guide:
- The ROI formula for technology, plus payback period, TCO, and net present value
- Why headline price understates true cost, often by three to five times
- The benchmarks for a "good" technology ROI and an acceptable payback period
- How SaaS waste and low adoption quietly destroy returns
- A weighted six-criteria scorecard to evaluate any business tool
Key Takeaway
Technology ROI is decided by the inputs you usually skip. Headline price is a fraction of true cost, and more than half of SaaS licenses generate no value. A structured framework that quantifies total cost of ownership, weights adoption likelihood, and demands a defined payback period is what separates the tools that pay off from the ones that become shelfware.

How to Calculate Technology ROI
The formula is simple; the rigor is in counting every cost and every benefit honestly. Enterprise software ROI is total quantified benefits minus total quantified costs, divided by total costs, expressed as a percentage. As Atiba's evaluation guidance stresses, the calculation should span three to five years (often five to seven for major systems) and must include hard costs like licenses and implementation alongside soft costs like internal staff time and change management. Benefits split into hard (labor and error-cost savings) and soft (faster decisions, better experience) categories.
Two companion metrics make the result usable. Payback period is the time until cumulative benefits exceed cumulative costs, which matters most for cash-constrained teams. Net present value, as The Hartford explains, discounts future cash flows so you compare value in today's money rather than nominal sums. Together, ROI percentage, payback, and NPV tell you not just whether a tool pays off, but how fast and how much in real terms.
| Metric | What It Answers | How to Read It |
| ROI % | Total return relative to cost | (Benefits - Costs) / Costs x 100; over 100% in 3 years is strong |
| Payback period | How fast you recoup the spend | Under 12-18 months is healthy for B2B software |
| TCO | The true lifetime cost | License plus implementation, integration, training, ops |
| NPV | Value in today's money | Discount future benefits and costs; positive NPV clears the bar |
Sources: Atiba (2025), The Hartford, IBM
For a concrete benchmark, Forrester's Total Economic Impact study of one major business platform found a composite organisation gained $685,742 in benefits against $221,776 in costs over three years, a net present value of $463,966, a 209% ROI, and payback in under six months. That is what a strong, well-adopted technology investment looks like when the math is done properly. We apply the same modelling discipline in our work on measuring AI automation ROI.
Why Headline Price Lies: Total Cost of Ownership

The number on the quote is the tip of the iceberg. IBM defines total cost of ownership as the full lifecycle cost of a product, including indirect costs like time spent adjusting to new systems, downtime, and end-of-life. EnerSys, applying Gartner-aligned benchmarks, puts hard numbers on it: for complex software such as ERP, first-year implementation costs often run three to five times the annual license or subscription fee. A tool that looks like a $50,000 line item can be a $200,000 first-year commitment once integration, configuration, and training are counted.
Then there is the cost that keeps recurring after launch: renewals, support contracts, upgrades, internal administration, and the silent drain of unused licenses. This is why a per-seat comparison is misleading and why a TCO view is non-negotiable. It is the same trap we flag when modelling AI automation cost and when weighing build versus buy: the cheapest sticker price is rarely the cheapest decision over five years.

SaaS Waste: The Silent ROI Killer
The biggest threat to technology ROI is not a bad purchase, it is a good purchase nobody uses. Zylo finds about 53% of SaaS licenses are unused or underused, and Certero reports 30 to 40% of licenses in a typical enterprise go unused, with large enterprises running over 300 applications. Flexera translates this into money: roughly $20 billion wasted globally each year on unused or overlapping SaaS, with overspend around 25%.
Scale makes it worse. Zylo's 2026 index shows organisations now average 305 applications and $55.7 million in annual SaaS spend, up 8% year over year, even as consolidation has stalled. For ROI, the lesson is blunt: a tool's return is a function of adoption, not access. If you buy 100 seats and 50 go idle, your real cost per active user doubles and your ROI halves. Adoption likelihood therefore belongs inside the purchase decision, not as an afterthought, which is why a structured workflow audit of where tools actually get used pays for itself.
Want to know which tools in your stack are actually earning their keep, and what to cut?
Book a Growth Mapping CallWhat Counts as a "Good" Technology ROI?

Benchmarks give you a bar to clear, but context decides the verdict. Across enterprise software evaluations, a return of 150 to 300% over three years, with payback under 12 to 18 months, is commonly cited as a strong outcome, and any ROI above 100% over three years generally clears the bar. The Forrester example above (209% ROI, sub-six-month payback) sits at the healthy end. For AI specifically the timeline stretches: Deloitte's 2025 research finds most AI use cases reach satisfactory ROI in two to four years, with only about 6% achieving payback in under a year.
Context matters because not every benefit is a hard dollar. A compliance tool may show a weak nominal ROI yet be non-negotiable for risk. A platform may pay back slowly but unlock strategic capability. The framework's job is to make the trade-off explicit, weighing hard savings, soft benefits, strategic necessity, and risk, rather than reducing the decision to a single number. This is the same balanced view we bring to AI ROI for B2B.
| Investment Type | Strong ROI Benchmark | Typical Payback |
| Enterprise B2B software | 150-300% over 3 years | Under 12-18 months |
| Well-adopted platform (Forrester example) | 209% over 3 years | Under 6 months |
| Workflow automation | 100%+ over 3 years | 4-12 months |
| AI / generative AI use case | Positive, but variable | 2-4 years (only ~6% under 1 year) |
Sources: Atiba (2025), Forrester TEI, Deloitte (2025)
Key Takeaway
A "good" ROI is one that clears your bar after honest TCO and realistic adoption are factored in. Treat 100%-plus over three years and payback inside 12 to 18 months as the default threshold for B2B software, hold AI to a longer two-to-four-year horizon, and never let a high projected return excuse high execution risk.
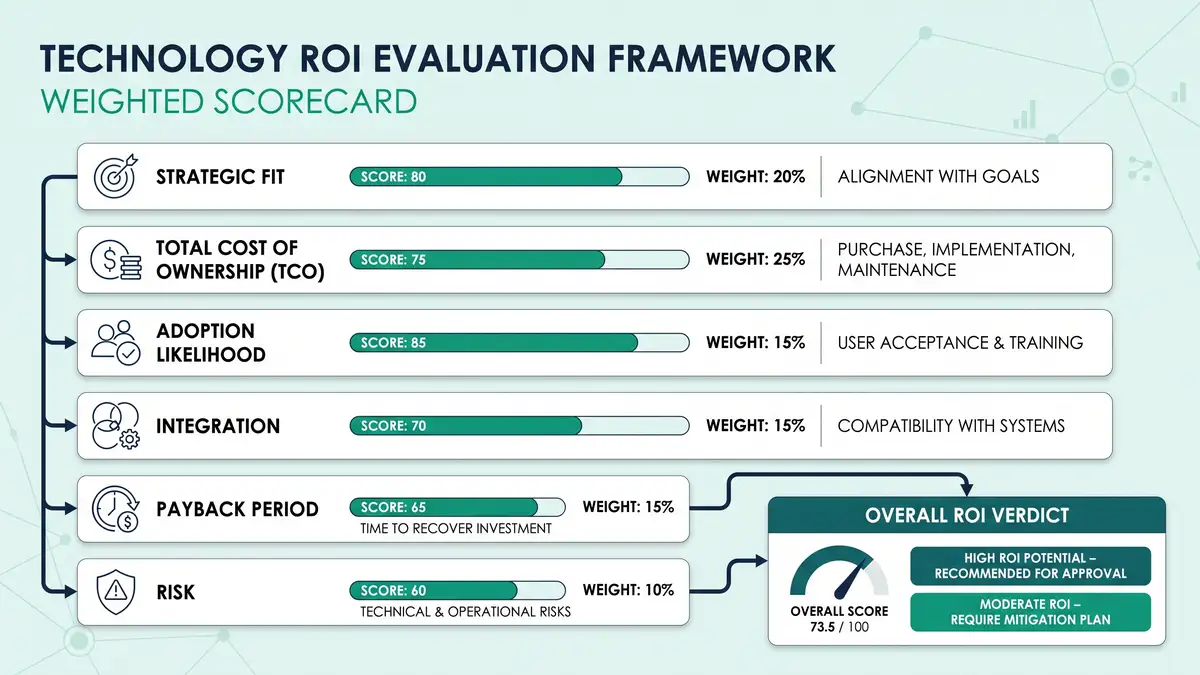
The Technology ROI Scorecard: 6 Criteria
Run every technology purchase through a weighted scorecard before you sign. Organisations that use a holistic, value-aligned evaluation framework are meaningfully more likely to see real results, and Forrester's 2024 research found that governance and structure, not technical issues, drive most failures. Score each criterion, weight by what matters for the decision, and let the total guide you.
Strategic fit
Does this tool advance a real priority, or is it a nice-to-have? Tools without a clear strategic owner are the ones that become shelfware.
Total cost of ownership
License plus implementation (often 3 to 5x license in year one), integration, training, renewals, and admin over three to five years. Never score on sticker price.
Adoption likelihood
Who will actually use it, and what is the realistic utilisation rate? With 53% of licenses idle industry-wide, adoption is the single biggest ROI lever.
Integration
How cleanly does it connect to your existing stack and data? Poor integration creates hidden cost and data silos that erode the benefit case.
Payback period
When do cumulative benefits overtake cumulative costs? Target under 12 to 18 months for most B2B tools; longer paybacks demand stronger strategic justification.
Risk
Probability of failed implementation, low adoption, or vendor lock-in. A 200% projected ROI with high execution risk can be worth less than a modest, certain return.
The discipline matters because the failure data is sobering. The Standish CHAOS research shows only about 31% of IT projects fully succeed, and large IT projects run 45% over budget on average, with the worst overshooting by hundreds of percent. A weighted scorecard plus stage-gated funding tied to outcomes is how you stay on the right side of those numbers.
How AI Changes the ROI Calculation
AI investments follow the same framework but with a wider spread of outcomes. Deloitte reports 74% of organisations are investing in AI and generative AI, and about 84% say they are gaining ROI somewhere in their portfolio. But BCG's 2025 analysis finds the value is concentrated: only about 5% of firms are generating significant AI value, while roughly 60% are reaping hardly any. The differentiator is execution, not the technology, which is exactly the pattern we document in why AI projects fail.
Avoid This Mistake
Do not evaluate AI on hype or peer pressure. Apply the same scorecard, but add the AI-specific cost lines most teams miss: data preparation (often 15 to 25% of total project cost), governance, and ongoing model maintenance. And weight adoption heavily, because an AI tool that your team does not trust or use returns nothing, no matter how capable it is.
The winning approach treats technology as a portfolio governed by one consistent ROI standard. Buy what clears the bar, govern it for adoption, measure it against the projected payback, and cut what underperforms. That is how you compound returns instead of accumulating shelfware, and it is the operating discipline behind a Freedom Machine and the deliberate way to approach scaling a B2B business.
Frequently Asked Questions
How do you calculate technology ROI?
Technology ROI is total quantified benefits minus total quantified costs, divided by total costs, expressed as a percentage. Calculate it over a three-to-five-year horizon, and include both hard costs (license, implementation, integration, support) and soft costs (internal staff time, change management). On the benefit side, count hard savings like reduced labor and errors plus soft gains like faster decisions. Pair the ROI percentage with payback period (when cumulative benefits overtake costs) and net present value (future cash flows discounted to today). The formula is simple; accuracy depends on counting every cost honestly, especially the ones beyond the sticker price.
What is a good ROI for a technology or software investment?
For enterprise B2B software, a return of 150 to 300% over three years with payback under 12 to 18 months is commonly considered strong, and any ROI above 100% over three years generally clears the bar. As a real benchmark, a Forrester study of one major platform found a 209% ROI and payback in under six months. AI investments typically take longer, with most use cases reaching satisfactory ROI in two to four years. Context matters: a compliance or risk tool may justify a weaker nominal ROI, while a strategic platform may pay back slowly but unlock capability. Always weigh hard savings, soft benefits, and risk together.
Why do most technology investments fail to deliver ROI?
Three reasons dominate. First, leaders underestimate total cost of ownership, where first-year implementation alone often runs three to five times the license fee. Second, adoption is low: about 53% of SaaS licenses sit unused or underused, so access does not equal value. Third, decisions are made without rigorous analysis or governance, and Forrester found governance breakdowns cause most digital-transformation failures, not technical issues. The result shows in the data: only about 35% of digital transformations hit their goals and only 31% of IT projects fully succeed. A structured ROI framework with adoption planning and stage-gated funding directly attacks all three causes.
What is total cost of ownership and why does it matter?
Total cost of ownership (TCO) is the full lifetime cost of a technology, not just its purchase price. It includes direct costs (license, implementation, hardware) and indirect costs (integration, training, downtime, internal administration, underutilised licenses, and eventual replacement). It matters because headline price systematically understates true cost: for complex software, first-year implementation can be three to five times the annual license fee, and ongoing renewals and admin compound over five years. Evaluating on TCO rather than sticker price is the single most important correction most B2B buyers can make, and it is central to any honest build vs buy comparison.
How much SaaS spend is typically wasted?
A lot. Zylo finds about 53% of SaaS licenses are unused or underused, Certero reports 30 to 40% of licenses go unused, and Flexera estimates roughly $20 billion is wasted globally each year on unused or overlapping SaaS, with overspend around 25%. The average company runs over 100 applications (large enterprises 300-plus), and consolidation has stalled even as spend rises. This waste is pure cost with no offsetting benefit, which is why adoption rate and license rightsizing belong inside every technology ROI calculation, not in a separate annual cleanup.
How should I evaluate an AI tool's ROI specifically?
Use the same framework with three additions. First, extend the timeline: most AI use cases reach satisfactory ROI in two to four years, and only about 6% pay back in under a year. Second, add the AI-specific cost lines teams routinely miss, especially data preparation (often 15 to 25% of total project cost), governance, and ongoing model maintenance. Third, weight adoption and trust heavily, because BCG found roughly 60% of firms reap hardly any AI value, almost always due to execution rather than the technology. Score strategic fit, TCO, adoption, integration, payback, and risk, then fund in stages tied to measured outcomes. Our guide to measuring AI automation ROI goes deeper.
Stop Buying on Hope. Decide on Evidence.
peppereffect quantifies the true total cost of ownership, the realistic adoption rate, and the payback period of your technology decisions, then architects the systems that actually get used and deliver returns. We turn tool sprawl and shelfware into a governed, ROI-positive stack.
Book Your Growth Mapping CallResources
- IBM - What Is Total Cost of Ownership
- The Hartford - Net Present Value Explained
- Atiba - Enterprise Software ROI Framework
- EnerSys - TCO Before Buying Software (2026)
- Forrester - Total Economic Impact of Microsoft Dynamics 365 Business Central
- Zylo - Shelfware: The Hidden Cost in Your SaaS Stack
- Zylo - 2026 SaaS Management Index
- BetterCloud - SaaS Statistics 2026
- Certero - SaaS Waste in Enterprise IT
- Flexera - Where SaaS Waste Hides
- BCG - Are You Generating Value from AI? The Widening Gap
- Deloitte - AI and Tech Investment ROI
- Standish Group CHAOS Report - IT Project Success Rates
- CIO.com - State of the CIO 2026