What Are the Most Important B2B SaaS Benchmarks for 2026?
The B2B SaaS benchmarks that matter in 2026 are no longer headline growth rates. The market has recalibrated. The median private B2B SaaS company now grows at 25–26% year-over-year, down from 30% in 2023, while the cost to acquire each pound of new ARR has climbed to £2.00 in sales and marketing spend — a 14% increase in 2024 alone and roughly double the 2022 baseline (Benchmarkit 2025 SaaS Performance Metrics). For mid-market SaaS founders managing $10M–$40M ARR, efficiency has replaced velocity as the dominant competitive signal: the Rule of 40, NRR above 110%, and CAC payback inside 12 months now determine valuation multiples and capital access. Rule of 40 benchmarks
This article deploys the 2026 benchmark data across the seven metrics that actually predict SaaS survival: growth rate, net revenue retention (NRR), churn and gross revenue retention (GRR), customer acquisition cost (CAC) and payback period, LTV:CAC, sales efficiency, and the Rule of 40. Every number is validated against private-company data from SaaS Capital's 14th annual survey of 1,000+ companies, Benchmarkit's 2025 report, High Alpha's analysis of 800+ SaaS companies, and ICONIQ Growth's 2025 State of Software.
What you'll learn in this article:
- The 2026 growth-rate benchmarks by ARR stage, funding type, and vertical specialisation.
- Why NRR above 110% has become the single most predictive metric of long-term SaaS success.
- How churn, gross revenue retention, and logo retention vary by ARPA band — and why one-number averages mislead.
- The CAC, CAC payback, and LTV:CAC benchmarks that separate top-quartile operators from capital-inefficient peers.
- Sales cycle length, pipeline coverage, quota attainment, and funnel conversion benchmarks.
- The Rule of 40 target that now dictates valuation multiples and growth-capital access.
- The AI-native performance tier that is redrawing the competitive map.
Key Takeaway
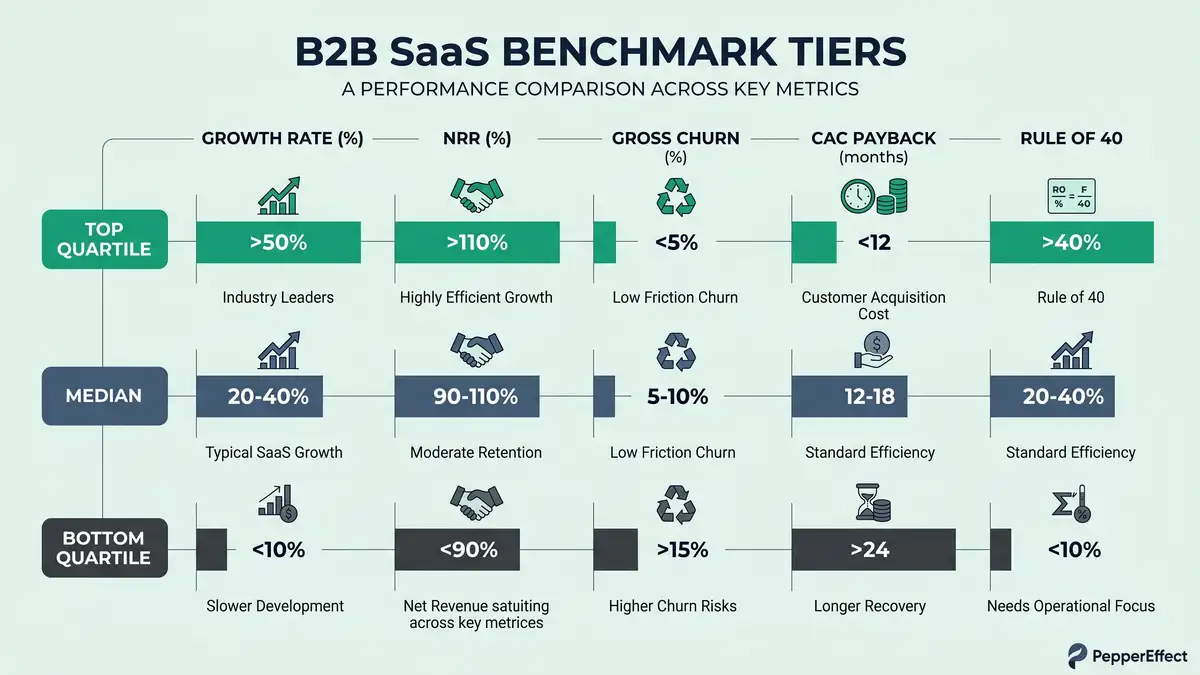
The 2026 SaaS market is a two-tier environment. Median performers post 101% NRR, 8.6-month CAC payback, and Rule of 40 scores of 35–40. Top-quartile operators achieve 110–120% NRR, 6-month payback, and Rule of 40 above 50 — commanding 30–50% valuation premiums. Benchmarks are the diagnostic layer. The leverage is operational: expansion-first customer success, organic-led acquisition, and AI-native product architecture.

Every benchmark band on this page in one spreadsheet: growth, NRR, GRR, gross margin, Rule of 40, CAC payback, magic number, LTV/CAC, and churn, with bottom-quartile, median, and top-quartile marks and sources. Drop your own numbers in alongside.
Download the 2026 SaaS benchmark dataset (CSV) ↓B2B SaaS Growth Rate Benchmarks 2026: Deceleration as Maturity
Median growth has compressed, but the aggregate masks a widening gap between top quartile and median operators. SaaS Capital's 14th annual survey of more than 1,000 private B2B SaaS companies establishes the 2026 baseline: median growth of 25–26%, with only 6.9% of respondents reporting flat or negative growth — down from the pandemic-era peak of 13% in 2020 (SaaS Capital 2025 Private SaaS Growth Rate Benchmarks). The baseline is healthier than the headline suggests. What has changed is the ceiling: top-quartile growth has compressed from 80–90% historically to 50–60% for companies in the $1M–$3M ARR band.
Stage matters more than ever. The $5M–$10M ARR segment shows median growth of 40–45% with top-quartile above 70%, while mid-market companies at $10M–$25M ARR — where Sarah Chen's cohort sits — report median growth of 30–35%, falling to 25–30% for the $25M–$50M band (G Squared CFO SaaS Benchmarks 2026). Funding type layers on another 500–700 basis point differential: VC-backed companies achieve 25–30% median with top quartile above 50%, while bootstrapped peers grow at 20–23% median with 90th-percentile performers reaching 51% (SaaS Capital Bootstrapped Benchmarks).
| ARR Stage | Median Growth | Top Quartile | Implication |
| $1M–$3M | 45–50% | 50–60% | Compressed ceiling vs. 80–90% historically |
| $5M–$10M | 40–45% | 70%+ | Highest absolute top-quartile growth band |
| $10M–$25M | 30–35% | 40–50% | Sarah Chen band — efficiency inflection |
| $25M–$50M | 25–30% | 40%+ | Expansion revenue becomes dominant engine |
| $50M+ | 20–25% | 30%+ | Platform scale — vertical bets re-accelerate |
Sources: SaaS Capital 2025, Benchmarkit 2025, G Squared CFO 2026
Vertical specialisation is now the single largest growth multiplier. Vertical SaaS — software designed for specific industries such as logistics, construction, and restaurants — is growing at 2–3x the rate of horizontal platforms. Samsara, Monday.com, Shopify, ServiceTitan, and Toast all reported Q1 2025 growth between 24% and 31%, while horizontal leaders including Salesforce (8%), Zoom (3%), and Twilio (5%) languished in single digits (SaaSMag Vertical vs. Horizontal 2026). For mid-market founders calibrating a SaaS growth strategy, 30% may be acceptable for a horizontal CRM but inadequate for a vertical specialist addressing a specific industry's operational crisis.
For mid-market SaaS leaders targeting $10M–$40M ARR, the operational implication is stark. The 25–30% median growth target is now the floor, not the ceiling. Top-quartile differentiation requires either product-led motion (where Benchmarkit data shows expansion ARR now represents 40% of total new ARR across all stages, rising to 50%+ above $37.5M) or a vertical specialisation that compounds switching costs. Sales-led motions can match top-quartile growth — but only when paired with disciplined B2B sales pipeline automation and efficient SaaS lead generation systems that decouple new-ARR velocity from headcount growth.
Want to know exactly which of these levers would reclaim the most hours in your business? Take the 4-minute Technician's Trap Scorecard.
Get My Personalised ReportNet Revenue Retention Benchmarks: The Most Predictive SaaS Metric
NRR above 110% is now the baseline for venture-quality unit economics. The median private B2B SaaS company sits at 101% NRR, down from 108% in 2022, yet top-quartile performers maintain 110–120% and elite operators exceed 120% (Benchmarkit 2025; Sparkco NRR Benchmarks). The compression reflects market maturity — existing customers are more disciplined purchasers — but the distinction matters because companies above 100% NRR grow indefinitely without acquiring a single new customer. The compounding effect of annual expansion drives faster topline growth and higher valuation multiples. For a complete decomposition, see our guide on net revenue retention as the #1 SaaS growth metric.
The correlation with growth rate is unambiguous. SaaS Capital's analysis of 1,000+ companies found that moving NRR from the 90–100% range to the 100–110% range improves growth rate by five percentage points. Companies with NRR above 115% report median growth that is 83% higher than the population median (SaaS Capital Growth Rate Study). This is the single largest lever in the SaaS operating system.
| ARR Stage | Median NRR | Top Quartile | Median GRR |
| <$750K | ~100% | 108% | 84–92% |
| $750K–$5M | 99–104% | 112% | 90–92% |
| $5M–$20M | 102–103% | 115% | 90–94% |
| $20M–$50M | 104–110% | 118% | 92–95% |
| $50M+ | 101–102% | 115%+ | 93–96% |
Sources: CustomerScore Churn Benchmarks, Monetizely Revenue Retention by Cohort, Benchmarkit 2025
NRR decomposes into gross revenue retention (GRR) — the revenue retained from existing customers excluding expansion — and the expansion component itself. Median GRR across private SaaS sits at 90%, with top-quartile firms achieving 95%+ (CustomerScore Churn Benchmarks). That implies the typical mid-market company retains 90p of every £1 of existing subscription revenue; the remaining 10% is lost to churn or contraction. The expansion layer — the uplift from that 90% baseline to the final 110%+ NRR figure — is the primary lever for growth without acquisition. Companies achieving 115–120% NRR typically demonstrate three characteristics: deep product usage and stickiness, a structured expansion motion powered by customer success automation (correlated with six-percentage-point NRR improvement per ChurnZero), and pricing architecture that allows natural expansion as customers grow.
Key Takeaway
Target NRR for $10M–$40M ARR mid-market SaaS is 105–115%, achieved through disciplined onboarding (reducing early-stage churn), proactive customer success that identifies expansion 6–12 months into contract, and pricing architecture (tiering or usage-based) that expands naturally. Anything below 100% signals acquisition must permanently exceed expansion — a capital-inefficient model.
You benchmark your revenue metrics. Benchmark your AI visibility too. Our free 3-minute AI Visibility Check measures how often the four AI engines cite you when buyers ask.
Run my free AI Visibility Check →SaaS Churn Rate Benchmarks: The ARPA Variance Most Founders Miss
The "under 5% annual churn is healthy" benchmark fails at the ARPA boundary. Companies serving £25–£50/month customers post a median monthly churn of 7.3%, with top-quartile firms at 5–6%, while accounts above £250/month churn at approximately 5.0% monthly (CustomerScore Churn Benchmarks). The compounding is non-linear: 2% monthly churn compounds to ~22% annual churn, not 24%. Lower-ARPA businesses often show higher blended churn rates because their customers have lower switching costs and more volatile usage patterns — not because the product is inferior.
The distinction between logo churn (percentage of customers who cancel) and revenue churn (percentage of revenue lost) is the difference between diagnosing "many small churners" and "a few large revenue losses" (Lighter Capital Logo vs. Revenue Churn). A company with 95% logo retention and 92% GRR is retaining many small customers but losing larger accounts — often the highest-risk segment if ROI hasn't been proven. The inverse — 85% logo retention with 95% GRR — signals low-revenue seats churning while large accounts stick. For enterprise-focused SaaS, logo retention is the primary stability metric; for mid-market and SMB, NRR is the superior leading indicator because it captures revenue impact.
Avoid This Mistake
Reporting a single company-wide churn number without segmenting by ARPA band, cohort, or customer segment is the most common SaaS diagnostic error. A 6% blended monthly churn could be 8% in the SMB tier and 2% in the mid-market tier — two completely different operational problems requiring different interventions. Always decompose churn by at least three dimensions: ARPA band, cohort month, and acquisition channel.
Vertical SaaS in logistics, construction, and restaurant operations — sectors with mission-critical workflows and high switching costs — shows revenue churn approximately 100–200 basis points lower than horizontal platforms at comparable ARPA (SaaSMag Vertical SaaS). This structural advantage — driven by integration depth, not product superiority — is why vertical SaaS has become the preferred private-equity target in 2026. For mid-market founders, systematic lead leakage elimination and B2B lead nurturing infrastructure compound these effects — you cannot out-retain weak onboarding.
Want to see your own CAC against peer benchmarks? Run the CAC Diagnostic for your true CAC, the 30 to 50% reduction agentic deployment delivers, and a board-ready PDF in 60 seconds.
Run the CAC DiagnosticCAC, CAC Payback, and LTV:CAC: The Unit Economics Triad
Acquisition is getting more expensive even as growth decelerates. The median SaaS company now spends £2.00 of sales and marketing expense for every £1.00 of new ARR acquired — a 14% increase from 2024 and roughly a 200% increase relative to the 2022 baseline. Bottom-quartile operators spend £2.82 per £1 of new ARR, while top-quartile firms achieve CAC ratios of £0.80–£1.20, paying less than parity to acquire new ARR (Benchmarkit 2025). This metric normalises for deal-size variation: a company acquiring 100 SMB customers at £5K ACV and a company acquiring one enterprise customer at £500K ACV both show £5K per-customer CAC, yet the enterprise firm's capital efficiency is materially superior if the CAC ratio is equivalent. For a full treatment, see our customer acquisition cost guide.
CAC payback — the number of months to recoup fully-loaded acquisition cost from gross-margin dollars — is the more actionable metric for mid-market leaders. The median SaaS company achieves CAC payback in 6.8 months; B2B SaaS specifically sits at 8.6 months, while B2C SaaS reaches 4.2 months (Proven SaaS CAC Payback Benchmarks). Early-stage companies under $750K ARR average 4.8 months; this extends to 8.8 months at $150K+ MRR as companies exhaust core audiences and move upmarket. The benchmark: under 12 months is healthy, 6–9 months is strong, below 3 months signals under-investment, and above 18 months indicates concerning capital inefficiency unless LTV is exceptionally high.
| Sales Motion | CAC Payback Target | LTV:CAC Target | Primary Lever |
| Product-Led (PLG) | 4–7 months | 4:1–6:1 | Activation + expansion |
| Mid-Market Sales-Led | 8–12 months | 3:1–5:1 | Win rate + cycle time |
| Enterprise Sales-Led | 12–18 months | 3:1+ | ACV + retention |
| Hybrid (Freemium + Sales) | 6–10 months | 4:1+ | Conversion + upsell |
Sources: Proven SaaS 2026, SaaSHero LTV:CAC Benchmarks 2026, Stripe CAC Guide
The LTV:CAC ratio converts the above into a single efficiency signal. The market benchmark is 3:1 minimum, with top-quartile SaaS at 4:1–6:1. Ratios below 2:1 signal an unprofitable acquisition engine; ratios above 6:1 often signal under-investment in growth. Channel-level CAC variation compounds this: organic and SEO-generated leads convert at 2.1% visitor-to-lead and 51% MQL-to-SQL, delivering 702% ROI over three years, while paid channels like Google Ads convert at 0.7% visitor-to-lead and 26% MQL-to-SQL with 78% ROI (ChurnZero Customer Success Platform). Mid-market SaaS investing heavily in paid acquisition without a strong organic foundation operates at a significant efficiency disadvantage.
Your 2026 growth ceiling is not your growth rate — it is your CAC payback. If payback exceeds 12 months, the leverage is in cutting acquisition cost through AI-native systems, not in spending more on paid channels.
Diagnose Your CAC ArchitectureSales Efficiency and Funnel Conversion Benchmarks 2026
Sales cycle length has stretched materially for mid-market B2B in 2026. The software industry average is 90 days, but the variance by deal size is enormous: under £6K ACV deals average 25 days, £6K–£38K deals average 55 days, £38K–£60K deals stretch to 120 days, and £600K+ deals can extend to 270 days (Focus Digital Sales Cycle Benchmarks). Prospect company size compounds this: 1–10-employee companies have 38-day cycles, while 5,001–10,000-employee companies average 158 days (Prospeo SMB vs. Mid-Market vs. Enterprise). This is structural, not operational: larger organisations have 6–10 stakeholders for enterprise, 2–6 for mid-market, formal procurement, security reviews, and legal negotiation cycles.
Pipeline coverage is the primary lever for managing cycle-length risk. Industry best practice: 3x–5x coverage for enterprise deals (reflecting longer cycles and lower win rates), 2.5x–4x for mid-market, and 2x–3x for SMB (Forecastio Pipeline Coverage Guide). A mid-market AE with a £250K quarterly quota needs £625K–£1M in active pipeline for consistent attainment. Remarkably, many mid-market organisations still operate without rigorous pipeline discipline, producing erratic quarterly performance — a gap that CRM automation and sales automation systems eliminate.
The funnel conversion bottleneck is the MQL-to-SQL stage. Visitor-to-lead averages 1.4% for mid-market (0.7% enterprise-focused, 2.1% industrial), lead-to-MQL averages 39–41%, and then the critical constraint: MQL-to-SQL conversion averages only 13–21% (The Digital Bloom 2025 Pipeline Benchmarks; Understory MQL-to-SQL Benchmarks). A five-percentage-point improvement at this stage alone increases total closed revenue by 12–18%. Three root causes: misaligned marketing/sales qualification logic, slow handoffs (responding in under an hour yields 53% conversion vs. 17% after 24 hours), and under-resourced SDR capacity forcing cherry-picking. Channel differentiation is significant — SEO-sourced leads convert MQL-to-SQL at 51%, substantially outperforming PPC (26%), email marketing (46%), webinars (30%), and events (24%).

Win rate varies sharply by segment: the overall B2B win rate sits around 21%, but SMB opportunity-to-close rates average 39%, mid-market drops to 30–32%, and enterprise falls to 31% or lower. High-value enterprise deals above £75K ACV deteriorate further to approximately 17%, meaning more than four of five enterprise opportunities that enter the pipeline do not close (Prospeo Segment Benchmarks). Quota attainment is the executive-level leading indicator: 60–70% of B2B SaaS reps meet or exceed quota annually, with SMB AEs at 44.8%, mid-market AEs at 43.9%, and enterprise AEs at 40.9% (DiGGrowth Quota Attainment).
The Rule of 40: The Market's Primary Efficiency Signal
The Rule of 40 — the sum of annual revenue growth rate and EBITDA margin — has become the dominant SaaS efficiency metric, outperforming both growth and NRR in correlation with public market valuation multiples. The median SaaS company scores 35–40, top-quartile performers consistently exceed 40, and elite operators reach 50+ (BCG Rule of 40 Lessons from Top Performers; ICONIQ State of Software 2025). For mid-market companies, achieving Rule of 40 above 40 requires either 35–40% growth with 5% EBITDA margin, 25% growth with 15% EBITDA margin, or any combination summing to 40+. The market is awarding valuation multiples 30–50% higher to companies scoring 40+ versus peers at 30–35.
Gross margin is the foundation. The median SaaS company achieves 77% gross margin on total revenue, with subscription revenue alone at 81% margin (CloudZero Gross Margin Benchmarks). Below 70% signals infrastructure inefficiency, high support costs, or service revenue drag. Contribution margin — gross margin minus fully-loaded acquisition and success cost — is the superior unit-economics signal: best-in-class SaaS achieves 60–75% contribution margin after year one, meaning £0.60–£0.75 of every customer pound is available for reinvestment by month 13 (Blossom Street Ventures Contribution Margin).
Key Takeaway
Revenue per employee tracks the same efficiency signal from a different angle. Median private SaaS achieves £97K per employee; $7.5M–$15M ARR companies average £150K; $37.5M+ averages £225K–£300K (SaaS Capital Revenue Per Employee). AI-native companies like Midjourney achieve roughly £18M revenue per employee — 90x the median — demonstrating the new performance tier AI integration creates.
The AI-Native Performance Tier: A New Benchmark Stratum
AI-native SaaS companies are operating as a distinct performance tier in 2026. High Alpha's analysis of 800+ SaaS companies found companies with AI deeply embedded in their products grow twice as fast as peers treating AI as a supporting feature (High Alpha SaaS Benchmarks). The gap is most dramatic in the $750K–$3.75M ARR cohort, where AI-native companies achieve 70% faster growth with similar starting conditions. AI-native companies also demonstrate 21% higher net revenue retention, driven by compounding value as models learn from customer data (Mixpanel Product Adoption Benchmarks).
The generational shift is architectural, not incremental. Of SaaS companies founded in 2016, none treated AI as core to their product. By 2025, 100% of new SaaS founders do. For mid-market leaders writing 2026–2027 product roadmaps, the strategic question is not whether to invest in AI but how to embed it such that customer outcome precision improves over time rather than merely automating existing workflows. This is the difference between AI for SaaS as foundational architecture and AI as a Copilot overlay.
Architect AI as Core, Not Overlay
Embed AI into the primary user workflow rather than appending a chatbot. Products where AI improves core outcome precision (e.g., more accurate forecasts, better recommendations) with each customer interaction build compounding moats.
Target 110%+ NRR as an Operational Baseline
Build a structured expansion motion: identify upsell opportunities 6–12 months into contract, deploy customer success automation for retention signal monitoring, and architect pricing tiers that expand naturally as customers grow.
Compress CAC Payback to Under 9 Months
Reallocate budget from paid acquisition to organic channels (SEO, content, product-led motions). Organic sources outperform paid channels by 5–9x on ROI and convert MQL-to-SQL at nearly double the rate.
Engineer Rule of 40 Above 45
Simultaneously invest in top-line growth and bottom-line profitability rather than treating them as trade-offs. Automate fulfillment, customer success, and operations to expand EBITDA margins without sacrificing growth.
Frequently Asked Questions
What is a good growth rate for B2B SaaS in 2026?
For B2B SaaS in 2026, median growth is 25–26% year-over-year, but targets vary by ARR stage and funding type. Companies at $1M–$3M ARR should target 45–50% median; $5M–$10M should aim for 40–45% with top-quartile above 70%; $10M–$25M (the mid-market band) should target 30–35% median and 40–50% top-quartile; $25M–$50M should target 25–30%. VC-backed companies tend to grow 500–700 basis points faster than bootstrapped peers. Vertical SaaS players are growing at 2–3x the rate of horizontal platforms, so calibrate your growth strategy against your vertical's benchmark rather than the aggregate.
What is a good NRR for B2B SaaS?
The median NRR for private B2B SaaS in 2026 is 101%, down from 108% in 2022. Top-quartile performers achieve 110–120% and elite operators exceed 120%. For mid-market SaaS at $10M–$40M ARR, 105–115% NRR is the operational target. Anything below 100% signals that acquisition must permanently exceed expansion, which is capital-inefficient. NRR above 115% correlates with 83% higher growth than the population median. For a complete treatment of NRR mechanics and levers, see our NRR guide.
What is a good churn rate for B2B SaaS?
Churn benchmarks vary sharply by ARPA. For accounts under £50/month, median monthly churn is 7.3% (top-quartile 5–6%). For accounts above £250/month, median monthly churn is approximately 5.0%, implying roughly 45% annual churn. For mid-market SaaS at $10M–$40M ARR, gross revenue retention (GRR) of 90%+ is typical, with top-quartile firms reaching 95%+. Always decompose churn by ARPA band, cohort month, and acquisition channel rather than reporting a single company-wide number — blended averages hide the diagnostic signal. Eliminating lead leakage upstream compounds retention effects downstream.
What is the average CAC payback period for SaaS?
The median SaaS company achieves CAC payback in 6.8 months. B2B SaaS specifically sits at 8.6 months; B2C SaaS reaches 4.2 months. Product-led companies typically achieve 4–7 months; mid-market sales-led companies fall in the 8–12 month band; enterprise-focused SaaS often extends to 12–18 months justified by higher LTV. Under 12 months is healthy, 6–9 months is strong, below 3 months may signal under-investment, and above 18 months indicates capital inefficiency unless LTV is exceptionally high. Organic channels compress payback dramatically — SEO-driven acquisition delivers 7-month break-even versus much longer paybacks for paid channels.
What is the Rule of 40 and why does it matter?
The Rule of 40 is the sum of a SaaS company's annual revenue growth rate and EBITDA margin. Companies scoring 40+ demonstrate balanced growth and profitability; the market rewards them with valuation multiples 30–50% higher than peers scoring 30–35. Median SaaS scores 35–40; top-quartile performers consistently exceed 40; elite operators reach 50+. For mid-market SaaS, hitting Rule of 40 requires either 35–40% growth with 5% EBITDA margin, 25% growth with 15% EBITDA margin, or any equivalent combination. It is the single most predictive public-market valuation signal and the efficiency benchmark capital markets have crystallised around in 2026.
What is a good LTV:CAC ratio for B2B SaaS?
The B2B SaaS benchmark is 3:1 minimum, with top-quartile companies achieving 4:1–6:1. Ratios below 2:1 signal an unprofitable acquisition engine and typically require either dramatic CAC reduction or LTV expansion via retention improvements. Ratios above 6:1 often indicate under-investment in growth — profitable customers exist, but the company is not acquiring enough of them. Product-led companies target 4:1–6:1; mid-market sales-led target 3:1–5:1; enterprise sales-led target 3:1+ justified by longer contract cycles. For deep mechanics, see our LTV:CAC ratio guide.
How does AI-native SaaS change the benchmark picture?
AI-native SaaS companies — those with AI embedded as foundational product architecture rather than as a supporting feature — grow twice as fast as traditional SaaS peers and achieve 21% higher NRR. The gap is largest in the $750K–$3.75M ARR band, where AI-native companies grow 70% faster. Burn multiples below 1.0x are becoming standard for AI-native startups versus 1.6x median for traditional SaaS. The implication: AI integration is no longer a differentiator — it is a baseline. Companies treating AI as a Copilot overlay will face 15–25% growth headwinds relative to AI-native competitors. Deploying AI for SaaS as core architecture is now the table-stakes strategic move.
Install Your 2026 SaaS Benchmark Operating System
peppereffect architects AI-powered operating systems for mid-market B2B SaaS CEOs. We install the lead generation engines, customer success automation, and pipeline systems that move you from median (101% NRR, 8.6-month CAC payback, Rule of 40 of 35) to top quartile (115% NRR, 6-month payback, Rule of 40 of 50+). Benchmarks diagnose the gap. Systems close it.
Book a Growth Mapping CallSee how to decouple revenue from headcount → AEO best practices for SaaS visibility HubSpot SEO for B2B SaaS
Keep architecting: related systems and tools
Free tools: go deeper on the individual metrics with the revenue per employee calculator, the net revenue retention calculator, and the ARPU calculator.
Install the systems: beating these benchmarks is an operating-system problem. Deploy AI lead generation systems, sales administration automation, and AI operations systems. See the AI for SaaS playbook.
Resources
- Benchmarkit — 2025 SaaS Performance Metrics (CAC ratio, NRR, unit economics)
- SaaS Capital — 2025 Private B2B SaaS Growth Rate Benchmarks (1,000+ companies)
- High Alpha — 2025 SaaS Benchmarks Report (800+ SaaS companies, AI-native analysis)
- ICONIQ Growth — State of Software 2025 (Rule of 40, expansion revenue)
- BCG — Rule of 40 Lessons from Top Performers in Software
- G Squared CFO — SaaS Benchmarks 2026
- Sparkco — Net Revenue Retention Benchmarks for B2B AI in 2025
- Proven SaaS — CAC Payback Benchmarks 2026
- CustomerScore — SaaS Churn Rate Benchmarks 2026 (by ARPA and ARR stage)
- SaaSHero — LTV to CAC Ratio Benchmarks for B2B SaaS 2026
- Bessemer — Cloud 100 Benchmarks Report 2025