

Recruitment firm profitability is the operating discipline that converts mandate flow into compounding margin. Boutique and mid-market search firms that treat profitability as a strategic operating metric rather than a year-end calculation compound EBITDA margins from 15-25 percent to 22-32 percent over 3 to 5 year horizons. The firms that focus only on revenue growth without margin discipline scale into a low-margin trap that compromises every strategic option, from partner compensation to exit valuation.
This guide architects recruitment firm profitability for managing directors of boutique to mid-market retained and contingency search firms (James Sterling persona). We benchmark revenue per recruiter, gross margin mechanics, EBITDA targets, the 7 profitability drivers, AI augmentation impact, valuation multiples, 8 execution pitfalls, and the 7-step optimization playbook. Every recommendation maps to the operating logic of building an executive search practice and reinforces the broader executive search KPI framework that compounds firm-level performance.
The Recruitment Firm P&L Architecture
The recruitment firm P&L resolves into five layers: revenue, cost of services, gross margin, operating expenses, and EBITDA. Per IBISWorld's analysis of the US executive search recruiters industry, the executive search and recruitment industry has matured into a mid-six-billion-dollar US market with structurally different P&L dynamics across retained search, contingency, and adjacent talent advisory layers.
Revenue: Mandate fees, project consulting, talent advisory, retainer subscriptions. Per Hunt Scanlon's Top 50 executive search firms ranking, the largest firms generate $700M to $1.6B+ in annual search fee revenue, with the long tail of boutique firms generating $1M to $20M each.
Cost of services: Recruiter compensation (40 to 60 percent of revenue typically), research staff, technology stack, mandate-specific expenses (assessment fees, candidate travel, background checks). Per RecruiterFlow's analysis of recruiter commission structures, the compensation architecture (base + commission + profit share + bonus pool) directly drives gross margin economics.
Gross margin: Retained search typically achieves 60-75 percent gross margin; contingency 40-55 percent; advisory and consulting layers 75-85 percent. Per Pacific International's analysis of retained executive search versus contingency recruitment, the architectural difference in fee structure (upfront retainer plus milestone payments versus contingent placement fee) drives the gross margin gap.
Operating expenses: Real estate (1-3 percent of revenue), marketing and BD (5-15 percent per peppereffect's executive search marketing framework), admin and operations (5-10 percent), partner overhead. Cumulative operating expenses 12-25 percent of revenue depending on scale and operating discipline.
EBITDA: Boutique firms typically achieve 15-25 percent EBITDA margin; mid-market firms 18-28 percent; top-tier firms with strong sector specialism and operating leverage 22-32 percent. Per FirstPageSage's consulting firm EBITDA valuation multiples, the EBITDA margin band is also the primary determinant of valuation multiples for firms approaching exit.
The profitability thesis
Recruitment firm profitability is not a year-end calculation. It is the multi-year compounding discipline that converts mandate flow into margin, margin into reinvestment capacity, and reinvestment into the operating leverage that builds defensible firm value. Boutique firms that operate without margin discipline scale into a low-margin trap; firms that treat profitability as the central operating metric compound 4 to 8 percentage point EBITDA premiums versus peers over 3 to 5 year horizons.

Revenue Per Recruiter Benchmarks 2026
Revenue per recruiter is the single most predictive operating metric of recruitment firm health. Per Hunt Scanlon's report on the executive recruiting sector's 11 percent growth and operating patterns observed across the Top 50 ranking, the 2026 benchmarks segment into three tiers based on firm scale, sector specialism, and operating maturity.
| Firm Tier | Revenue Per Recruiter | Typical Profile |
| Boutique (sub-25 seats) | $400k-$1M | Single-sector specialism, partner-led |
| Mid-market (25-100 seats) | $700k-$1.5M | Multi-sector, multi-geography, growing brand |
| Top-tier global (100+ seats) | $1M-$3M+ | Premium brand, retained focus, advisory layers |
Sources: Hunt Scanlon Top 50 firms ranking, Bullhorn GRID 2026, Christian and Timbers PE recruiters rankings
Per American Staffing Association's top 5 staffing trends for 2026, the firms outperforming on revenue per recruiter are those investing in AI-augmented productivity infrastructure, sector specialism, and disciplined mandate mix toward higher-fee retained engagements. Per Great Recruiters' research on customer retention, 79 percent of placement revenue at top-performing firms comes from repeat clients, which directly amplifies revenue per recruiter through reduced BD overhead.
The 7 Profitability Drivers
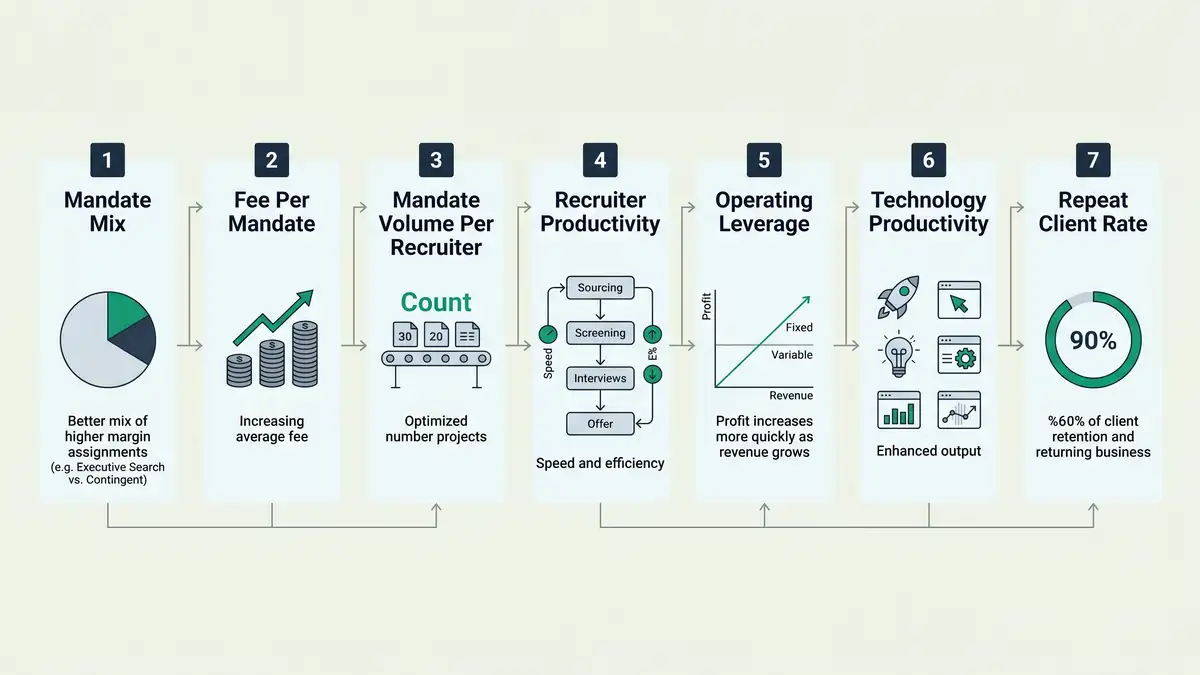
Mandate mix: retained versus contingency versus advisory
Retained mandates carry 60-75 percent gross margin versus 40-55 percent for contingency. A 10 percentage point shift from contingent to retained translates into a 2 to 4 percentage point gross margin lift. Mix discipline is the highest-leverage profitability driver for firms moving up-market.
Average fee per mandate
Per Pact and Partners' comprehensive overview of executive search fees, retained search fees typically range from 25-35 percent of first-year compensation. Boutique firms commanding premium 33 percent fees versus market 25 percent capture an 8 percentage point revenue premium per mandate that flows directly to margin.
Mandate volume per recruiter
Mature boutique recruiters typically handle 5-8 active mandates concurrently with 12-20 mandate completions per year. Per Corporate Navigators' analysis of average time-to-fill by industry, time-to-fill compression directly enables higher mandate volume per recruiter. AI-augmented sourcing and assessment typically compresses time-to-fill by 25-40 percent.
Recruiter productivity
Per RecruiterFlow's recruitment ROI analysis, recruiter productivity (mandates closed per quarter, candidate engagement velocity, BD conversion rate) varies 2-3x across a firm's recruiter cohort. Top decile recruiters drive disproportionate firm profitability; bottom decile underperformance compounds against the firm.
Operating leverage from overhead amortization
Real estate, technology, marketing, and admin overhead amortize across the revenue base. A firm growing revenue 30 percent while holding overhead constant captures 3-5 percentage points of EBITDA lift. The discipline of holding overhead flat through growth phases is what compounds enterprise EBITDA above boutique benchmarks.
Technology productivity uplift
Per Bullhorn's GRID 2026 industry trends, top-performing recruitment firms deploying AI report 3.5 to 4.5x revenue growth versus laggards. Technology investment as percent of revenue (typically 2-5 percent for boutiques) drives 25-40 percent productivity uplift when paired with disciplined adoption. peppereffect's analysis of recruitment CRM software details the vendor selection mechanics that compound this productivity lever.
Repeat client rate
Per Great Recruiters' customer retention research, 79 percent of placement revenue at top-performing firms comes from repeat clients. Repeat mandates carry materially lower BD cost (no proposal cycle, no positioning sell), which translates directly into 4-8 percentage point margin premium. Repeat rate is the compound interest of recruitment firm profitability.
EBITDA Margin Benchmarks and Valuation Multiples
EBITDA margin is the profitability metric that translates directly into firm value at exit. Per FirstPageSage's consulting firm EBITDA valuation multiples and A Simple Model's analysis of private equity roll-ups, recruitment firms trade at 3-7x EBITDA for boutique scale, 5-10x for mid-market with operating maturity, and 8-15x for premium retained firms with strong sector specialism.

| Firm Profile | EBITDA Margin Band | Valuation Multiple |
| Boutique single-sector | 15-25% | 3-7x EBITDA |
| Mid-market multi-sector | 18-28% | 5-10x EBITDA |
| Top-tier global retained | 22-32% | 8-15x EBITDA |
| PE-backed roll-up platform | 20-30% | 7-12x EBITDA |
Sources: FirstPageSage EBITDA valuation multiples, A Simple Model PE roll-up analysis, Equidam EBITDA multiples by industry
Per Hunt Scanlon's analysis of how search firms are positioning for the 2025 rebound, the firms commanding the highest multiples at exit are those with disciplined repeat client economics, sector-specialism brand, advisory revenue layers, and demonstrable AI-augmented productivity advantage. The multiple is not just about EBITDA size; it is about EBITDA defensibility and growth trajectory.
Need help architecting your firm's profitability optimization roadmap?
Book a Growth Mapping CallAI Augmentation Impact on Recruitment Firm Profitability
AI augmentation has reshaped the profitability equation for recruitment firms through 2026. Per Bullhorn's GRID 2026 industry trends report, top-performing firms deploying AI report 3.5 to 4.5x revenue growth versus laggards. The productivity uplift compounds across multiple P&L layers.

What AI augments at the revenue line: candidate sourcing at scale (HireEZ, SeekOut, Loxo), conversational candidate screening (Paradox, Mya), AI-augmented assessment, predictive matching, automated communication. Revenue per recruiter typically lifts 25-40 percent in mature deployments. Per BCG's analysis of how AI will reshape more jobs than it replaces, the productivity uplift is not about replacing recruiters but about augmenting them to handle higher mandate volume.
What AI augments at the margin line: gross margin typically lifts 5-10 percentage points through reduced research staff overhead, faster mandate cycles, and lower per-mandate operational cost. EBITDA typically lifts 4-8 percentage points combining the revenue uplift and operating leverage. Per The Undercover Recruiter's analysis of the 2026 recruiter tech stack, the firms compounding the productivity lift are those treating AI as core infrastructure rather than experimental add-ons. peppereffect's broader guidance on AI for executive search details the human-AI workflow architecture that drives this margin lift.
Compensation Architecture and Profitability Impact
Recruiter compensation is the single largest cost line for most firms. Per RecruiterFlow's analysis of recruiter commission structures, typical compensation as percent of fees ranges from 40-60 percent depending on tenure, productivity, and firm scale. Per Glassdoor's recruitment consultant salary data, base compensation varies 2-3x across recruiter tenure with commission structures driving the variable component.
The four common compensation architectures and their profitability implications:
| Architecture | Typical Structure | Profitability Impact |
| High base, low commission | 70% base, 30% commission | Stable margin, limits upside |
| Balanced base + commission | 50% base, 50% commission | Aligned incentives, moderate margin |
| Eat-what-you-kill (high commission) | 30% base, 70% commission | Lean structure, volatile margin |
| Equity + profit-share partnership | Base + partner pool | Compounding firm-level alignment |
Sources: RecruiterFlow recruiter commission structures, Glassdoor recruitment consultant salary data
Operating Expense Discipline
Operating expenses are the silent driver of EBITDA. Per Osborne Financial Search's analysis of what real estate and recruitment have in common, the firms that scale margin are those that maintain operating expense discipline as revenue grows. Cumulative operating expenses for mature boutiques typically land in the 12-25 percent of revenue band.

Real estate: Typical 1-3 percent of revenue. The 2026 shift toward hybrid and remote operating models has compressed this layer significantly. Boutique firms with predominantly virtual operations report sub-1 percent real estate cost.
Marketing and BD: Per peppereffect's executive search marketing framework, mature firms allocate 5-15 percent of mandate revenue to marketing investment. Under-investment compresses mandate flow over time; over-investment compresses margin without proportional return.
Technology stack: Per SOAL Tech's IT staffing cost breakdown for 2026, technology cost as percent of revenue typically 2-5 percent for boutiques with operating leverage as the firm scales. The discipline is selecting platforms that compound productivity rather than accumulating disconnected tools.
Admin and operations: Finance, HR, operations, governance overhead typically 5-10 percent of revenue. Operating leverage discipline keeps this layer flat through revenue growth.
8 Profitability Optimization Pitfalls
1. Underpriced mandates
Discounting retainer fees to win mandates compresses margin permanently. Per Pact and Partners' executive search fees overview, boutiques pricing below the 25-33 percent retainer band compound a 2-5 percentage point margin deficit versus disciplined-pricing peers over multi-year horizons.
2. Mix drift from retained to contingent
Drifting toward contingent mandates because they close faster trades 20+ percentage points of gross margin for short-term revenue. Defend the retained mandate mix through positioning and BD discipline.
3. Compensation inflation without productivity match
Per ADP Research's analysis of pay trends to watch in 2026, compensation pressure across the industry has lifted base salaries 4-7 percent annually through 2025-2026. Firms that lift compensation without matching productivity uplift compress margin year-over-year.
4. Technology stack sprawl
Accumulating tools without integration produces 4-6 percent of revenue in stack cost with marginal productivity return. Discipline the stack to integrated platforms that compound rather than disconnected tools that duplicate.
5. Real estate over-investment
Premium office space signals brand authority but compresses margin if recruiter productivity does not justify the cost. The 2026 hybrid operating model allows boutiques to invest in selective premium space (client meeting rooms, partner offices) while distributing core operations.
6. Marketing underinvestment
Cutting marketing investment to protect short-term margin compresses long-term mandate flow. Per peppereffect's executive search marketing framework, mature firms protect the marketing investment band even through downturns because mandate flow lags marketing investment by 6 to 12 months.
7. Governance neglect at scale
Firms growing past 25 seats without governance discipline (quarterly business reviews, financial reporting cadence, partner alignment) compound coordination costs that compress EBITDA. Per Hybrid Hero's analysis of consulting firm margin compression, governance neglect is the single most common driver of margin erosion in scaling firms.
8. Founder bottleneck
Firms where the founder personally handles BD, mandate delivery, and operations cap revenue at the founder's bandwidth. Per Monkhouse and Company's analysis of recruitment bottlenecks for scaling, the founder bottleneck pattern is the single most common scaling constraint in boutique firms.
The 7-Step Profitability Optimization Playbook
Baseline P&L audit
Document the firm's current P&L architecture across revenue, cost of services, gross margin, operating expenses, and EBITDA. Benchmark against industry tier (boutique, mid-market, top-tier). The audit is the baseline against which all optimization investment is measured.
Mandate mix analysis
Calculate revenue and margin contribution by mandate type (retained, contingent, project, advisory). Identify mix shift opportunities toward higher-margin segments. peppereffect's analysis of retained search versus contingency fee structures details the architectural levers.
Productivity benchmarking
Measure revenue per recruiter, mandates closed per quarter, candidate engagement velocity, BD conversion rate across the recruiter cohort. Identify top decile patterns and replicate. peppereffect's executive search KPI framework details the dashboard architecture.
Technology stack rationalization
Audit the technology stack against productivity contribution. Consolidate fragmented tools into integrated platforms. peppereffect's analysis of recruitment CRM software for boutique firms details the consolidation framework.
Compensation architecture alignment
Pressure-test the compensation structure against firm-level profitability goals. High-commission structures align partner economics but increase margin volatility; equity-plus-profit-share structures compound long-term alignment but require disciplined valuation methodology.
Marketing investment optimization
Calibrate marketing investment against mandate flow attribution. Mature firms allocate 5-15 percent of revenue with measurement discipline tying spend to mandate inquiries, conversion rate, and repeat client rate.
Quarterly governance cadence
Install quarterly business reviews that surface profitability variance, recruiter performance, mandate mix drift, and operating expense discipline. Governance cadence is the discipline that compounds the prior 6 levers into sustained profitability uplift over multi-year horizons.
Architect Your Firm's Profitability Operating System With peppereffect
peppereffect installs the AI-augmented operating system that compounds recruitment firm profitability across revenue, gross margin, and EBITDA. We architect the P&L architecture, benchmark productivity, optimize the technology stack, align compensation, calibrate marketing investment, and engineer the governance discipline that converts mandate flow into compounding firm value.
Book a Growth Mapping CallFrequently Asked Questions About Recruitment Firm Profitability
What is the typical EBITDA margin for a recruitment firm?
Boutique recruitment firms typically achieve 15-25 percent EBITDA margin. Mid-market firms with operating maturity typically achieve 18-28 percent. Top-tier global retained firms with sector specialism and advisory layers typically achieve 22-32 percent. Per FirstPageSage's analysis of consulting firm EBITDA valuation multiples, the EBITDA margin band is the primary determinant of valuation multiples at exit. The mix between retained, contingent, and advisory revenue is the largest driver of variance within each tier.
What is revenue per recruiter and what are 2026 benchmarks?
Revenue per recruiter measures annual mandate fee revenue divided by recruiter headcount. 2026 benchmarks: boutique firms (sub-25 seats) typically $400k to $1M per recruiter, mid-market firms (25-100 seats) $700k to $1.5M, top-tier global firms $1M to $3M+. Per Hunt Scanlon's Top 50 firms ranking, the firms outperforming on revenue per recruiter combine sector specialism, AI-augmented productivity, disciplined mandate mix, and 70+ percent repeat client rate.
How much does AI augmentation improve recruitment firm profitability?
Per Bullhorn's GRID 2026 industry trends report, top-performing firms deploying AI report 3.5 to 4.5x revenue growth versus laggards. The productivity uplift compounds across the P&L: revenue per recruiter lifts 25-40 percent, gross margin lifts 5-10 percentage points through reduced research staff overhead and faster mandate cycles, and EBITDA lifts 4-8 percentage points combining the revenue and operating leverage effects. The firms compounding the lift are those treating AI as core infrastructure rather than experimental add-on.
What is the gross margin difference between retained and contingency search?
Retained search typically achieves 60-75 percent gross margin versus 40-55 percent for contingency. Per Pacific International's analysis of retained executive search versus contingency recruitment, the architectural difference (upfront retainer plus milestone payments versus contingent placement fee) drives the gross margin gap. Per MLA Global's contingency versus retained analysis, a 10 percentage point mix shift from contingent to retained translates into a 2 to 4 percentage point gross margin lift.
What valuation multiples do recruitment firms command at exit?
Per FirstPageSage's consulting firm EBITDA valuation multiples and A Simple Model's PE roll-up analysis, recruitment firms trade at 3-7x EBITDA for boutique scale, 5-10x for mid-market with operating maturity, 8-15x for premium retained firms with strong sector specialism, and 7-12x for PE-backed roll-up platforms. The multiple depends on EBITDA defensibility (repeat client rate, sector specialism, advisory revenue layers) and growth trajectory.
How do I optimize recruitment firm profitability?
The 7-step optimization playbook: 1) Baseline P&L audit; 2) Mandate mix analysis (shift toward retained and advisory); 3) Productivity benchmarking (revenue per recruiter, top decile pattern replication); 4) Technology stack rationalization (consolidate fragmented tools); 5) Compensation architecture alignment (balance commission structures with firm-level economics); 6) Marketing investment optimization (5-15 percent of revenue with measurement discipline); 7) Quarterly governance cadence (compound the prior 6 levers through review discipline). The firms that compound EBITDA from 15-25 percent to 22-32 percent over 3-5 years operate all 7 levers in disciplined sequence.
What are common recruitment firm profitability pitfalls?
The 8 most common pitfalls are: 1) Underpriced mandates compress margin permanently; 2) Mix drift from retained to contingent trades 20+ percentage points of gross margin; 3) Compensation inflation without productivity match compresses margin annually; 4) Technology stack sprawl produces 4-6 percent revenue cost with marginal return; 5) Real estate over-investment compresses margin without proportional brand value; 6) Marketing underinvestment compresses long-term mandate flow; 7) Governance neglect at scale compounds coordination costs; 8) Founder bottleneck caps revenue at the founder's bandwidth. Each pitfall is preventable with disciplined operating discipline. scaling without losing culture playbook recruitment technology stack for placement velocity operations manual that drives margin business development pipeline that compounds repeat client revenue niche vs generalist strategy that drives margin recruitment firm valuation framework
Resources
- IBISWorld: US Executive Search Recruiters Industry
- Hunt Scanlon: Top 50 Executive Search Firms
- Hunt Scanlon: Executive Recruiting Sector Grew 11 Percent
- Hunt Scanlon: How Search Firms Are Positioning for 2025 Rebound
- Bullhorn: GRID 2026 Industry Trends
- Bullhorn: GRID 2026 Industry Trends Report
- FirstPageSage: Consulting Firm EBITDA Valuation Multiples
- A Simple Model: Private Equity Roll-up
- Equidam: EBITDA Multiples by Industry
- Pact and Partners: Executive Search Fees Overview
- Pacific International: Retained vs Contingency Recruitment
- MLA Global: Contingency vs Retained Search
- RecruiterFlow: Recruiter Commission Structure
- RecruiterFlow: Recruitment ROI
- Glassdoor: Recruitment Consultant Salary
- Great Recruiters: Customer Retention Rate Research
- BCG: AI Will Reshape More Jobs Than It Replaces
- Corporate Navigators: Average Time-to-Fill by Industry
- The Undercover Recruiter: 2026 Recruiter Tech Stack
- SOAL Tech: IT Staffing Cost Breakdown 2026
- Osborne Financial Search: Real Estate and Recruitment
- ADP Research: Pay Trends 2026
- Hybrid Hero: Consulting Firm Margins Shrinking
- Monkhouse and Company: Recruitment Bottleneck for Scaling
- Christian and Timbers: Top PE Recruiters US 2026 Rankings